


Overview
- Updated On:
- 09/02/2026
- 437 m2
Property Description
Property & Project Overview
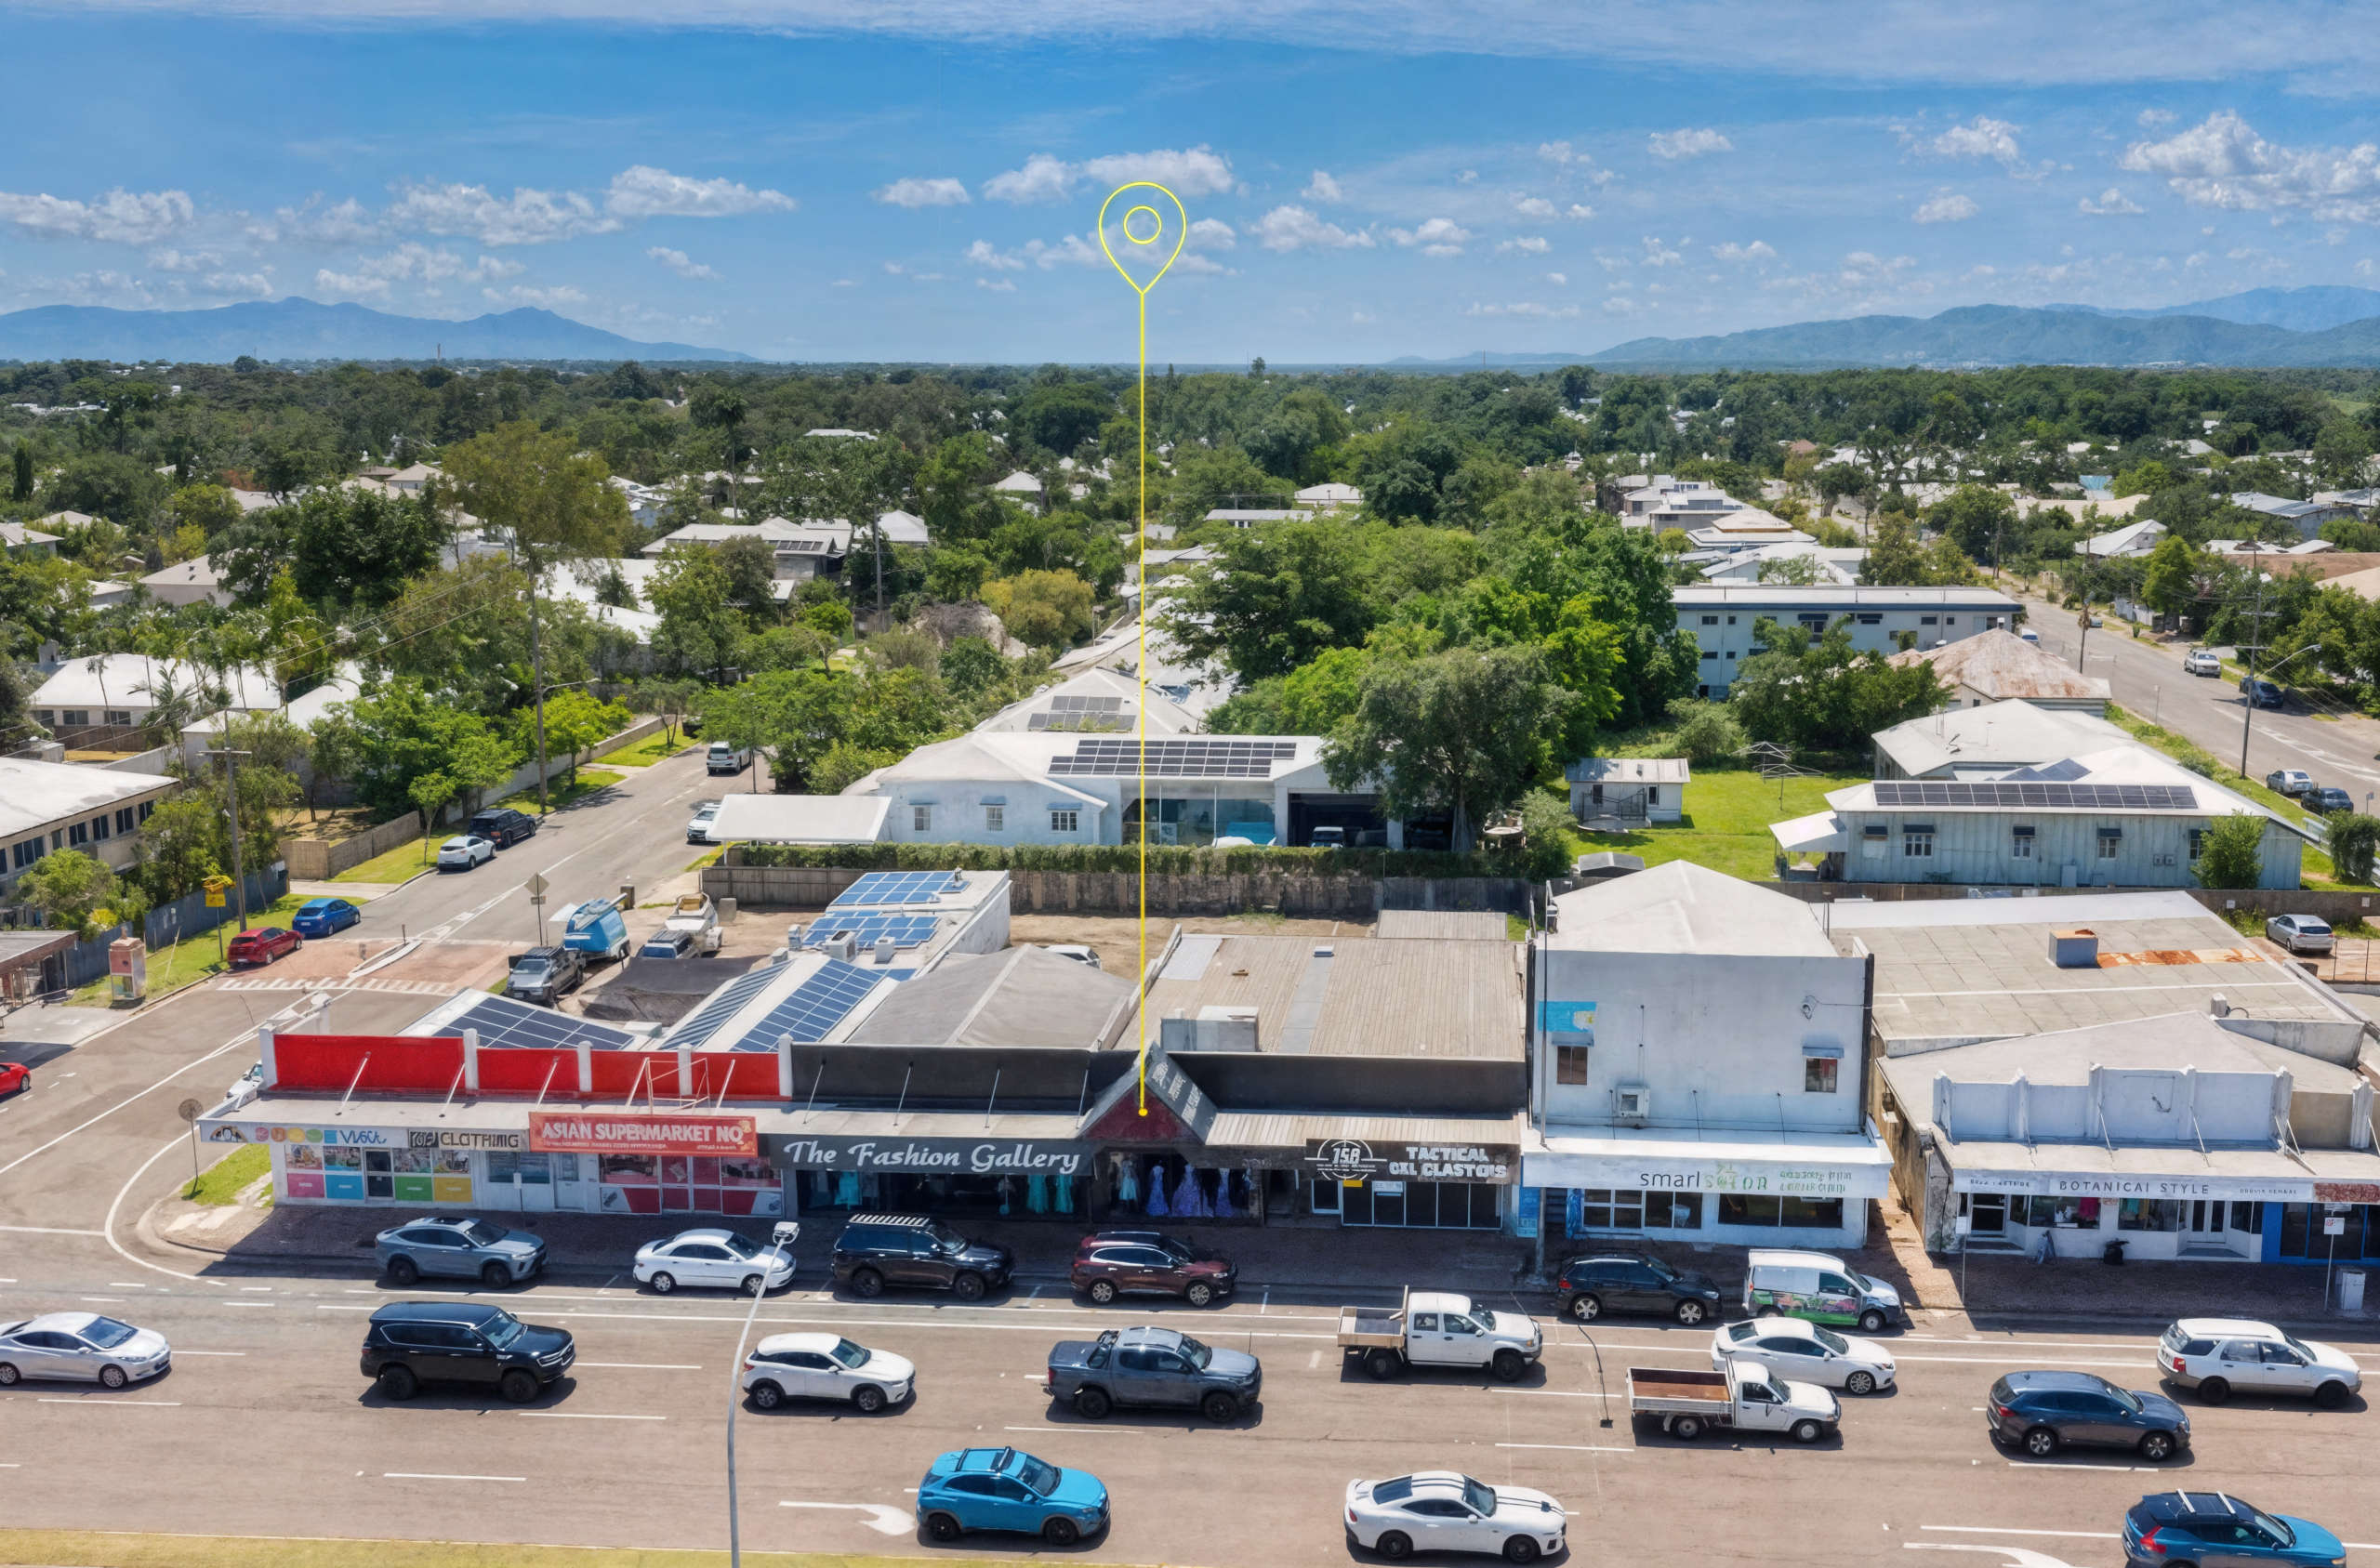
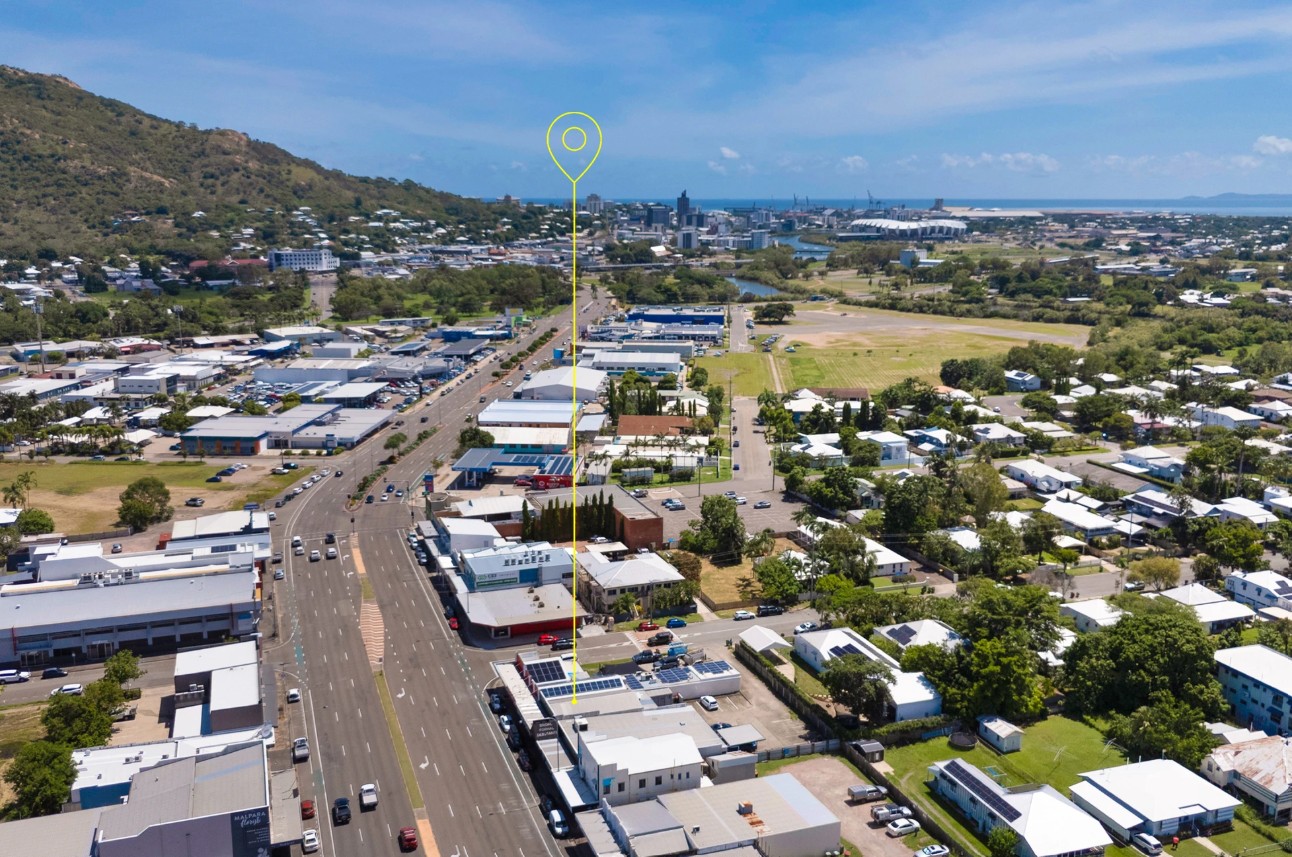
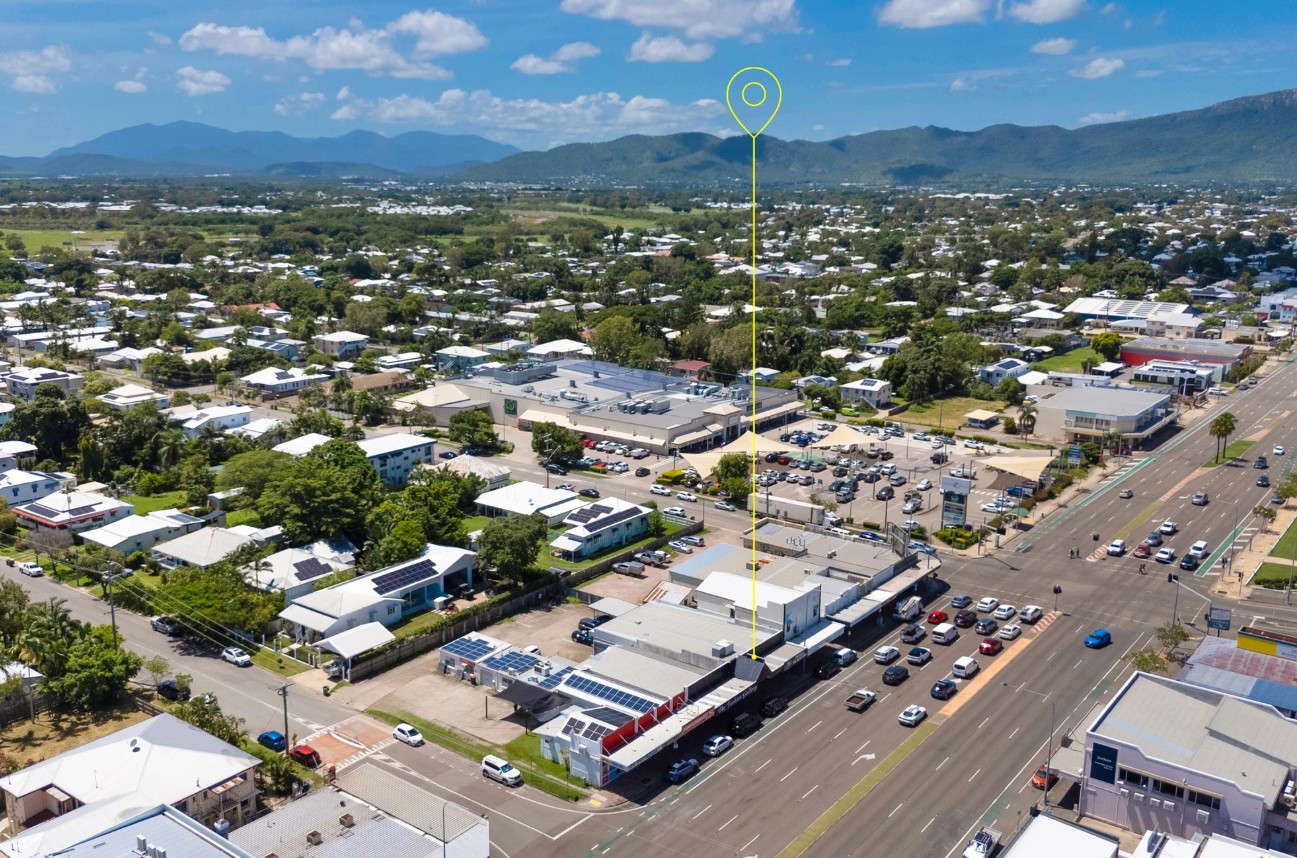
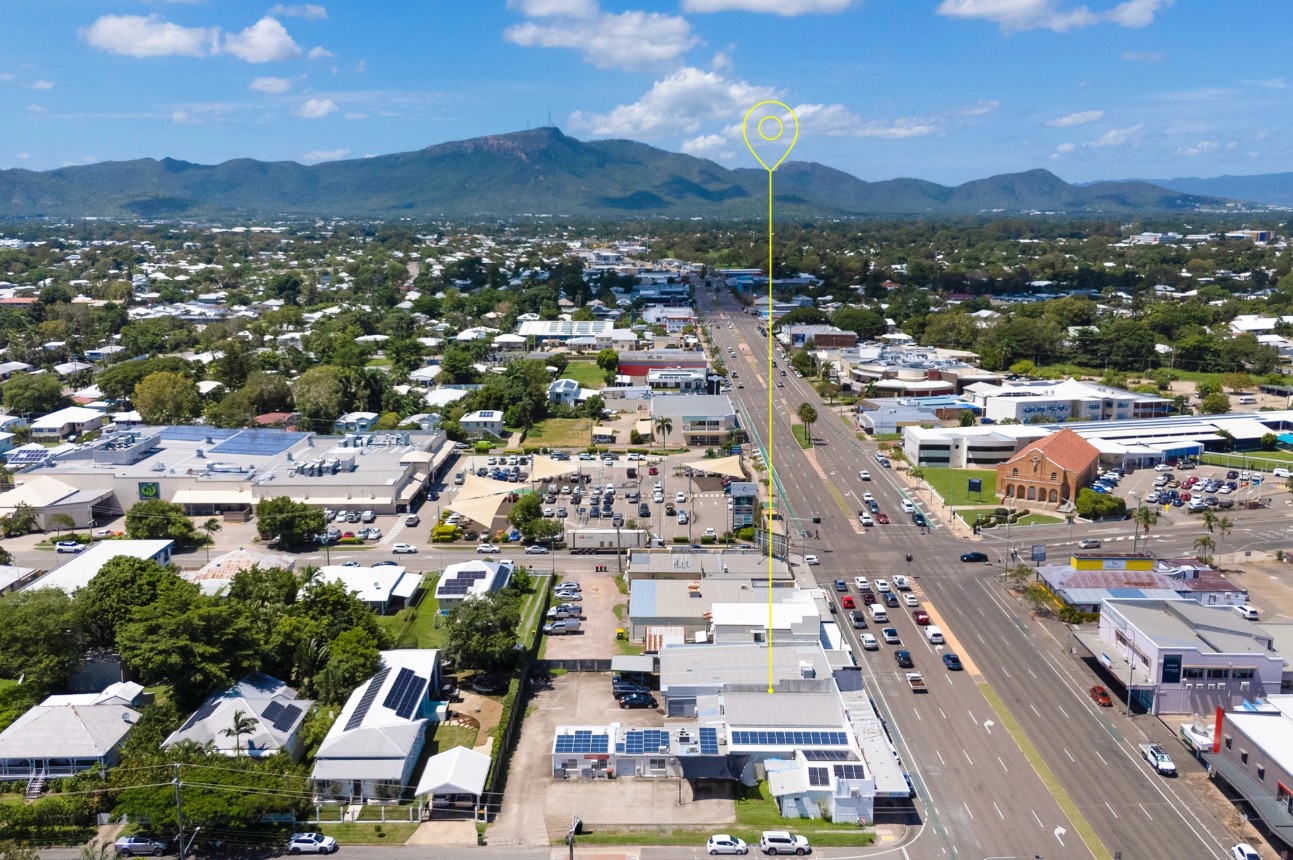
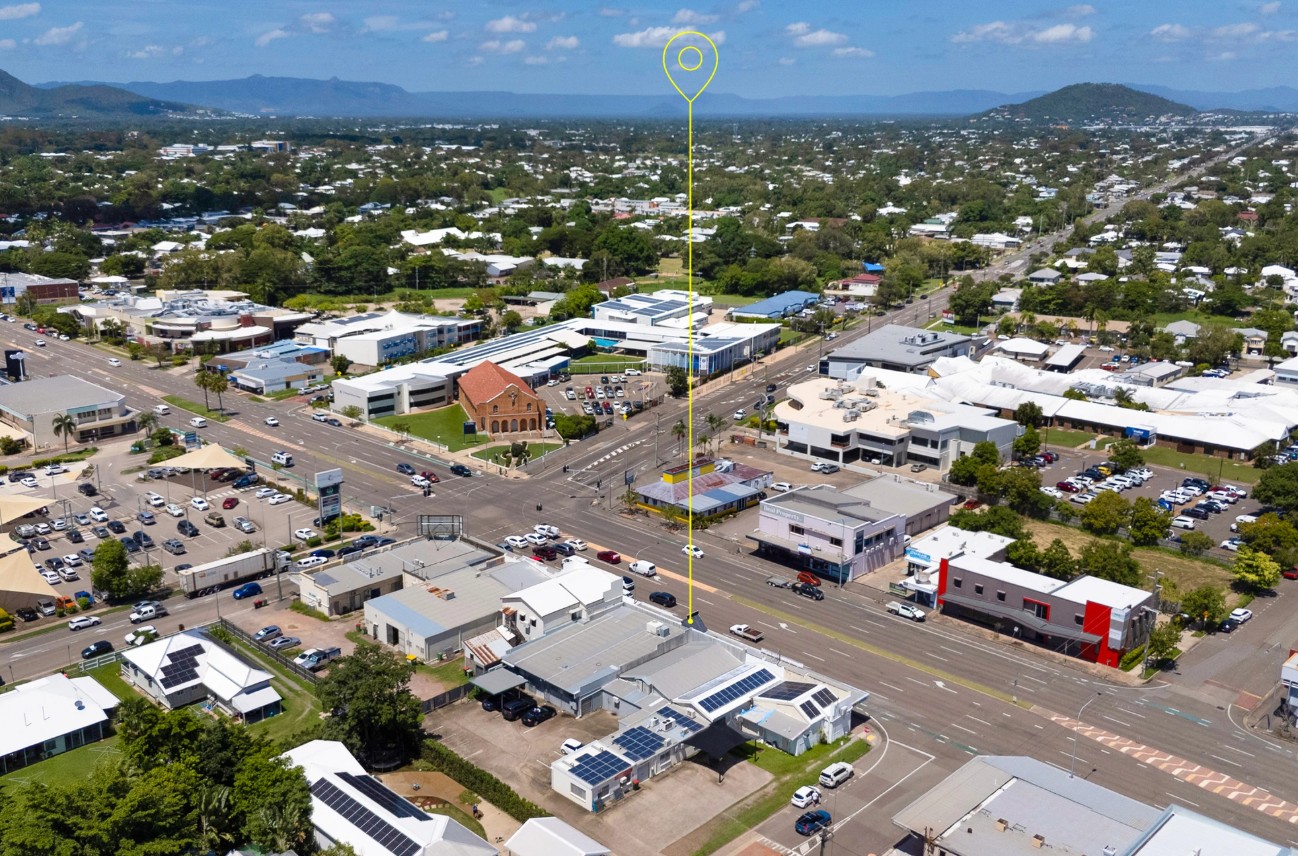
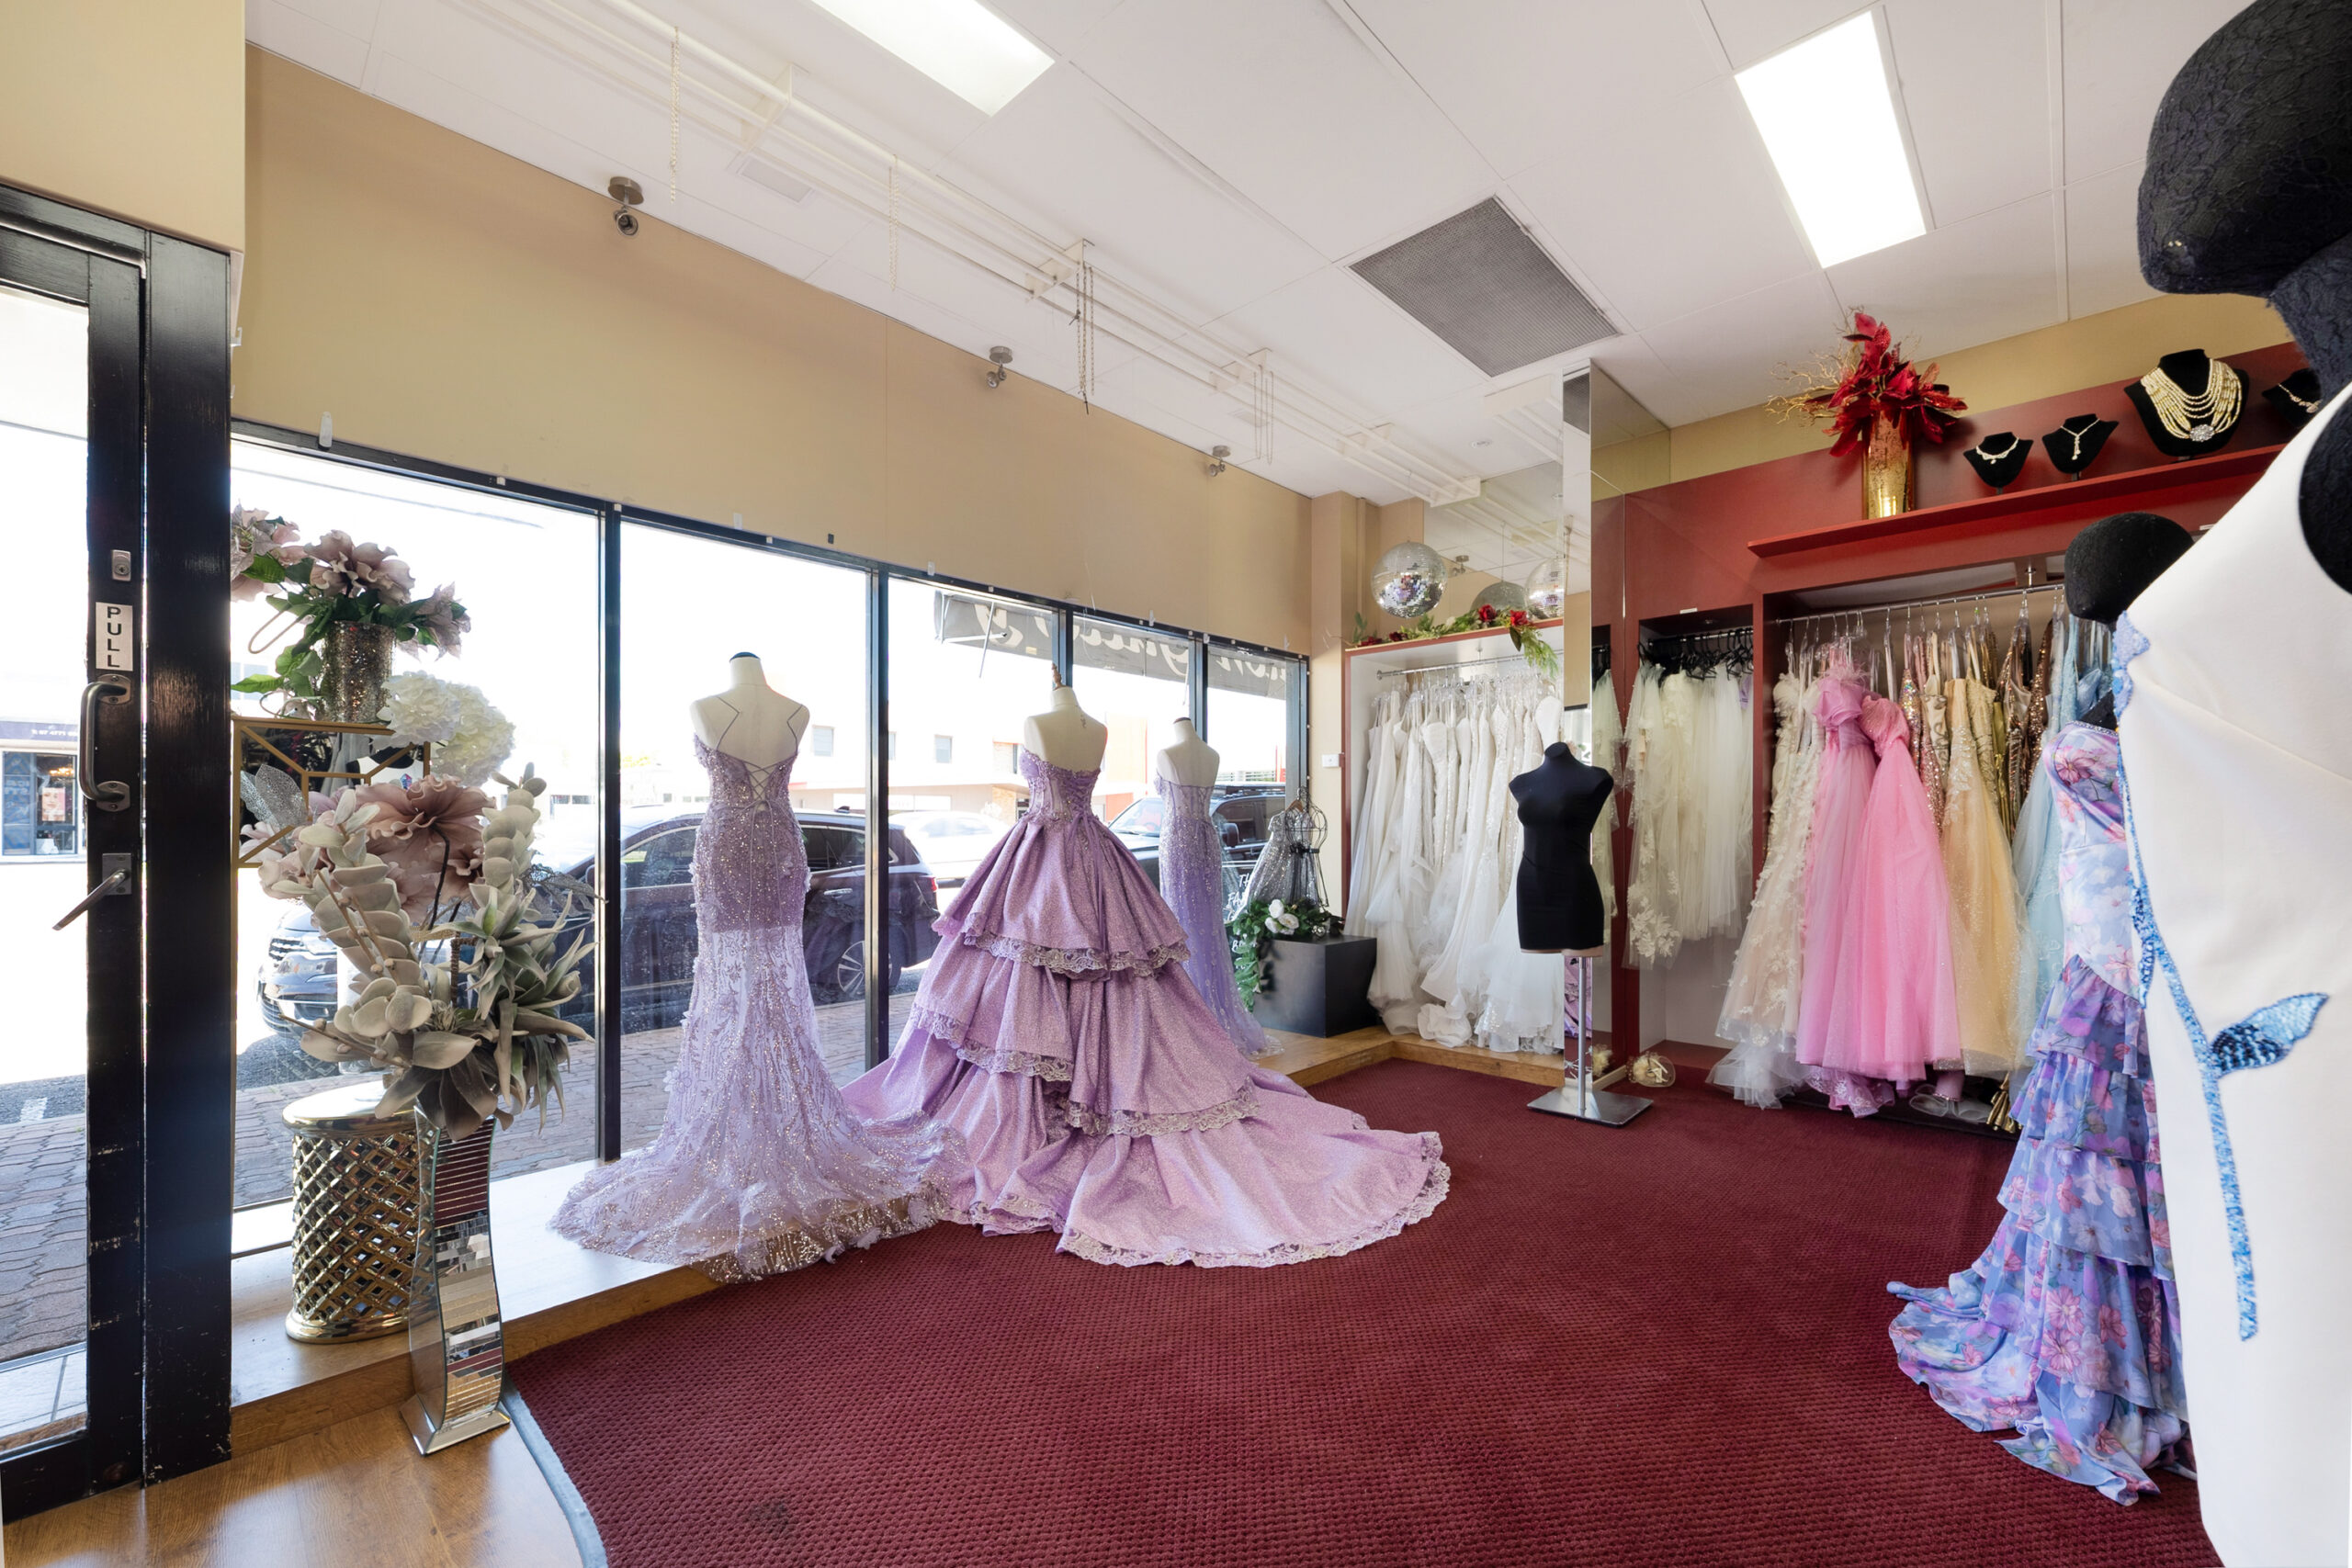
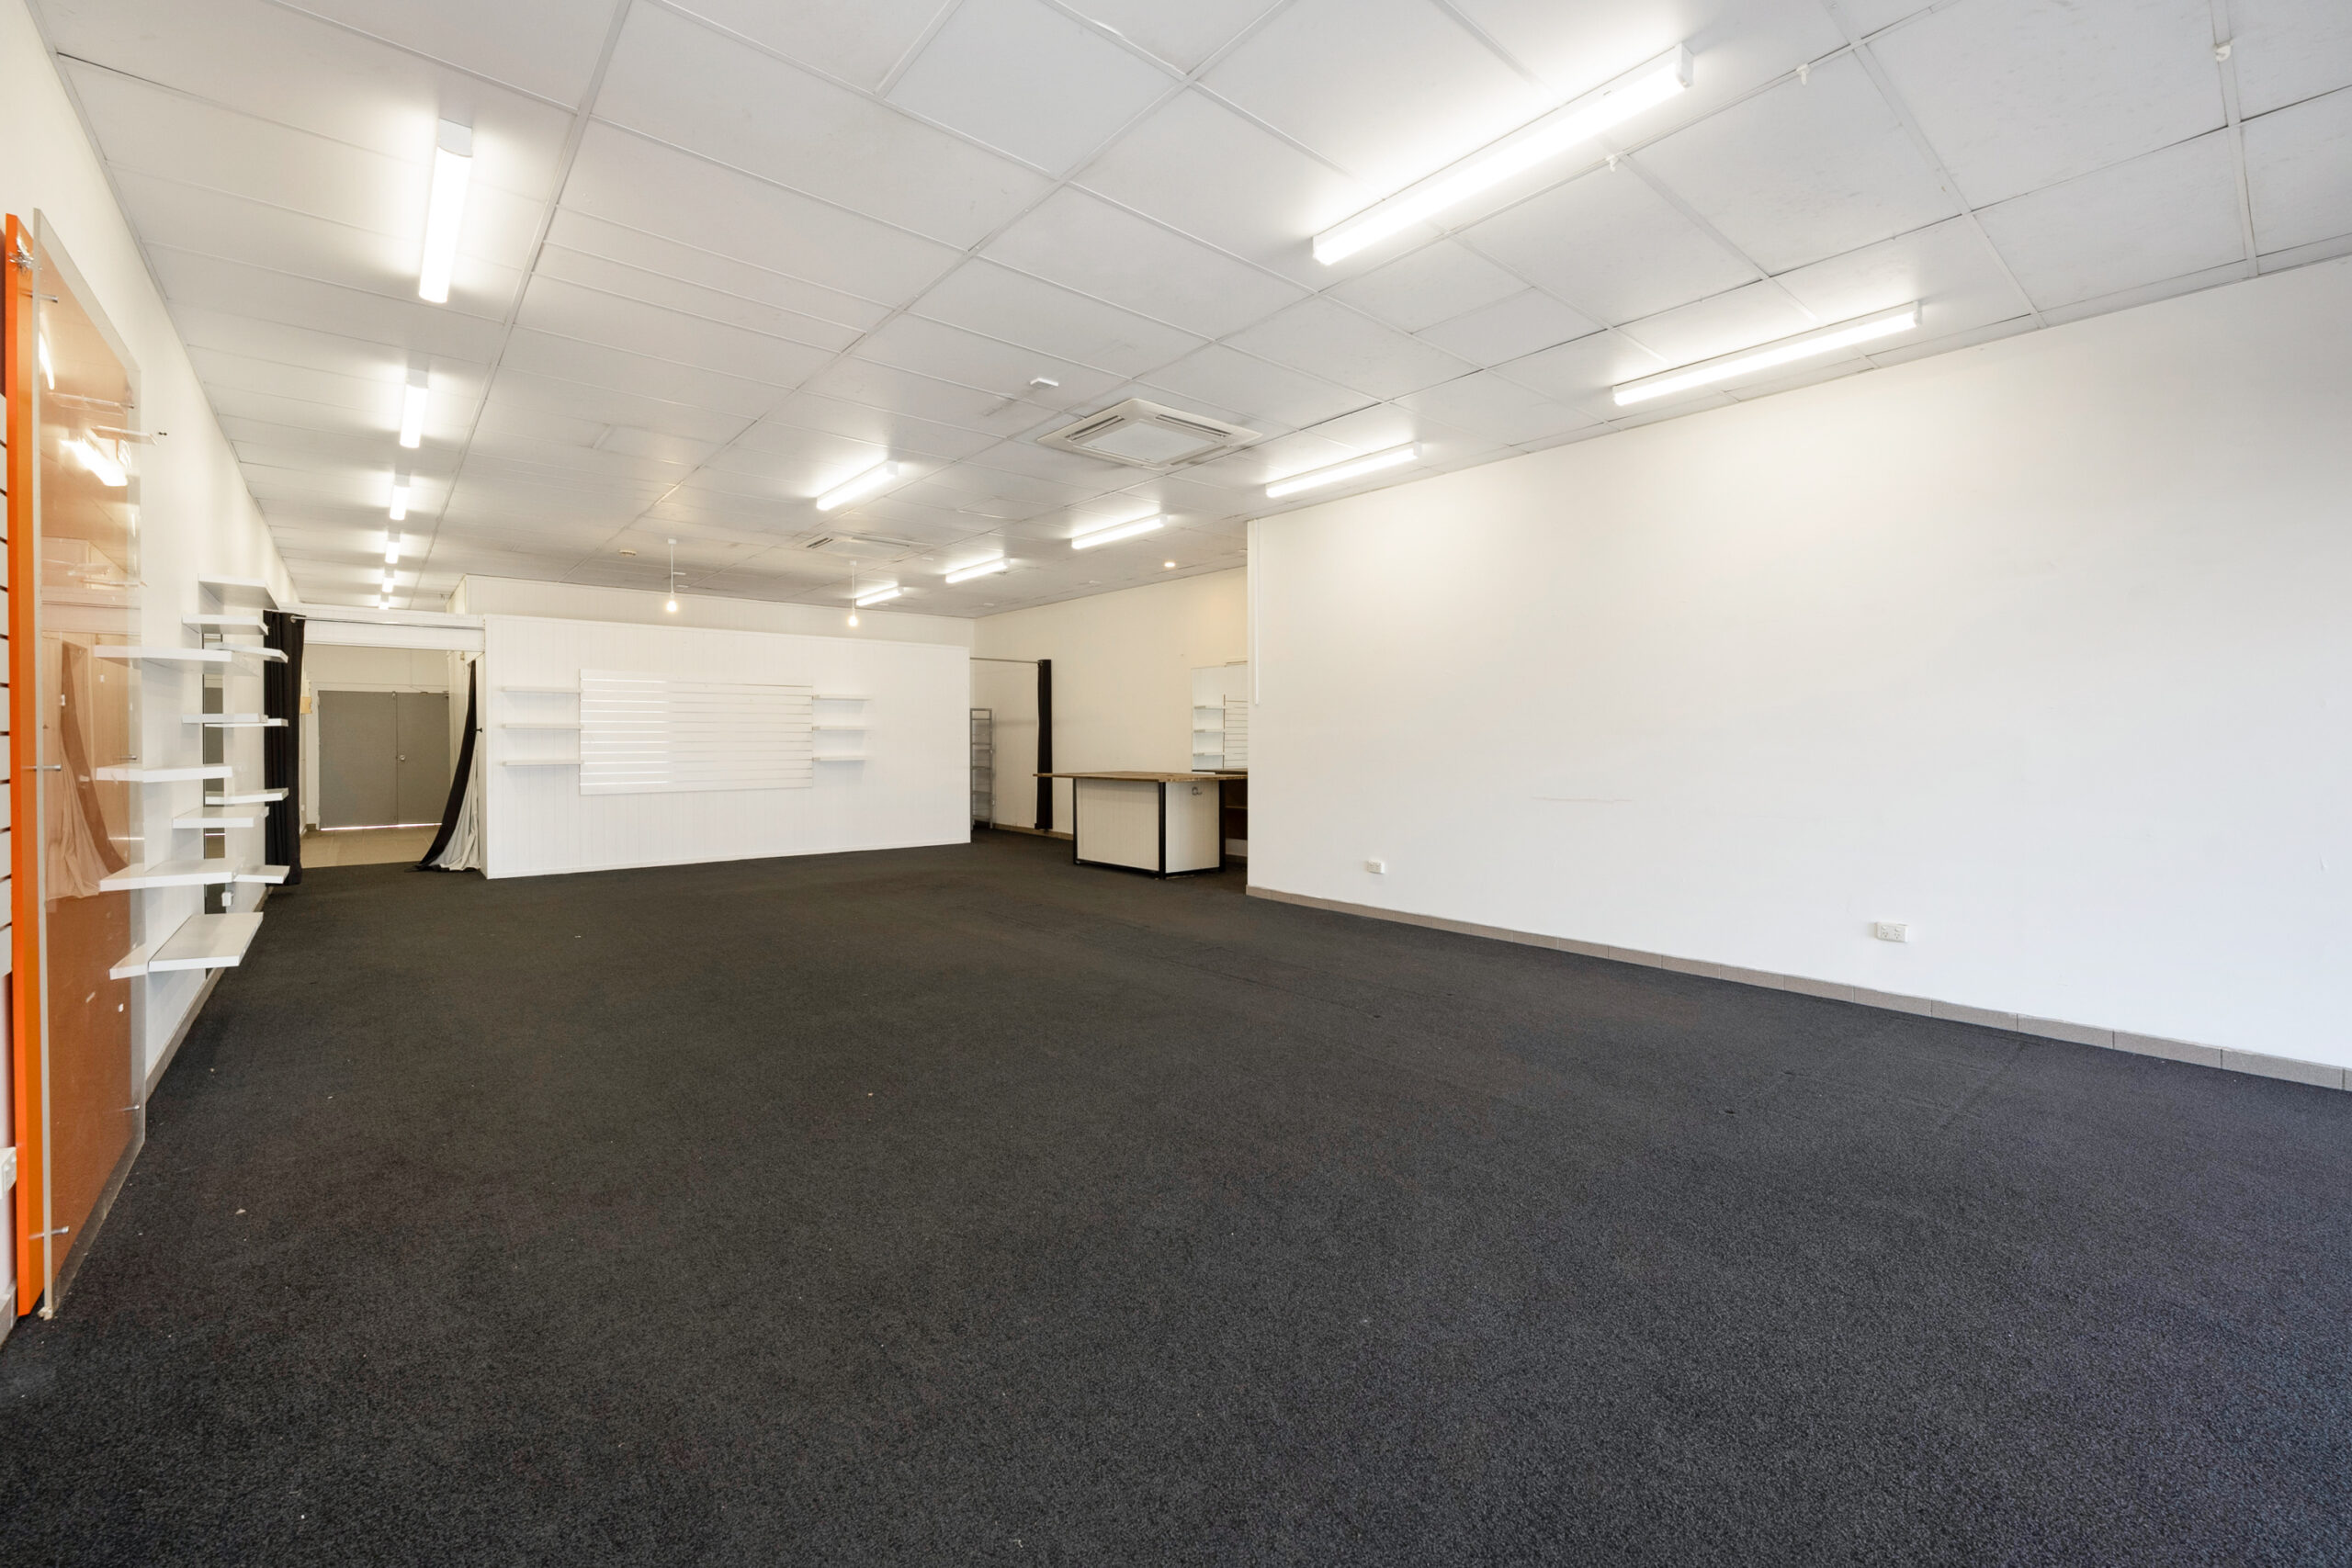
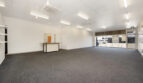
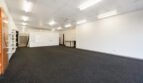
Located on one of Townsville’s most popular commercial strips, with over 26,000 vehicles passing daily, 114 Charters Towers Road features:
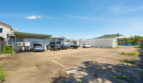
- Land area: 930 sqm
- Building area: 437 sqm
- Configured as three separate commercial tenancies that can be sold or leased individually
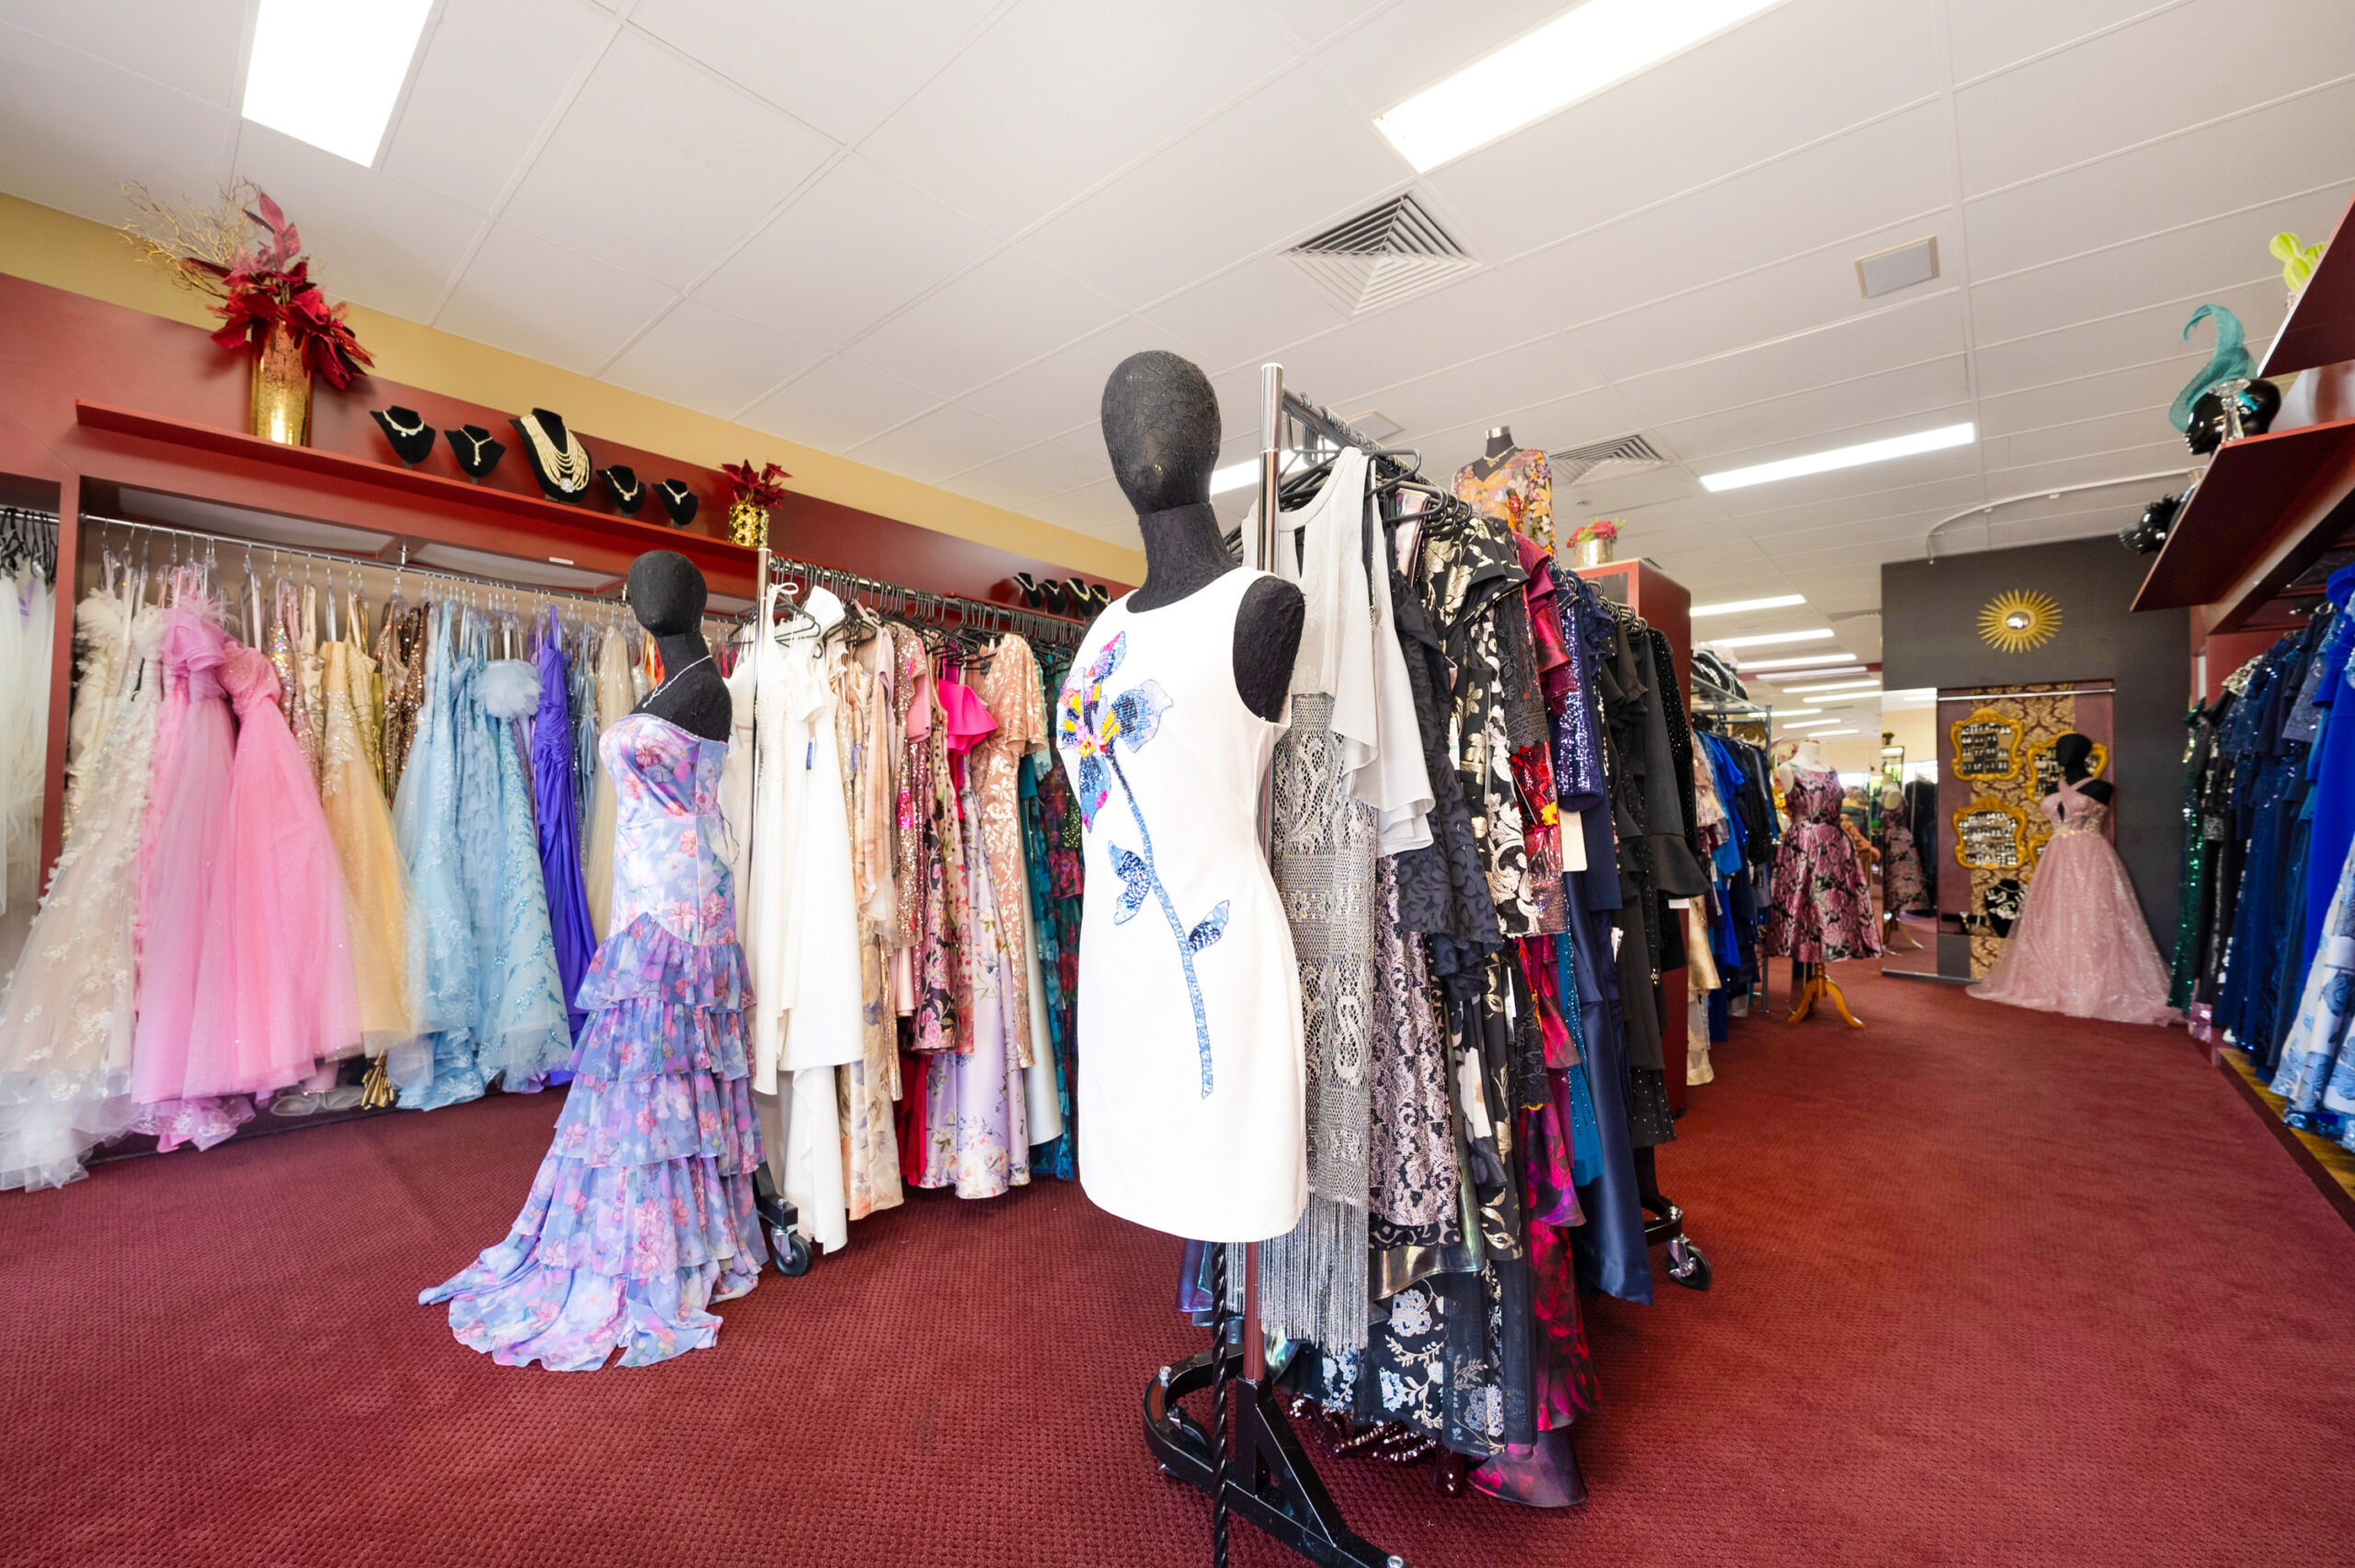
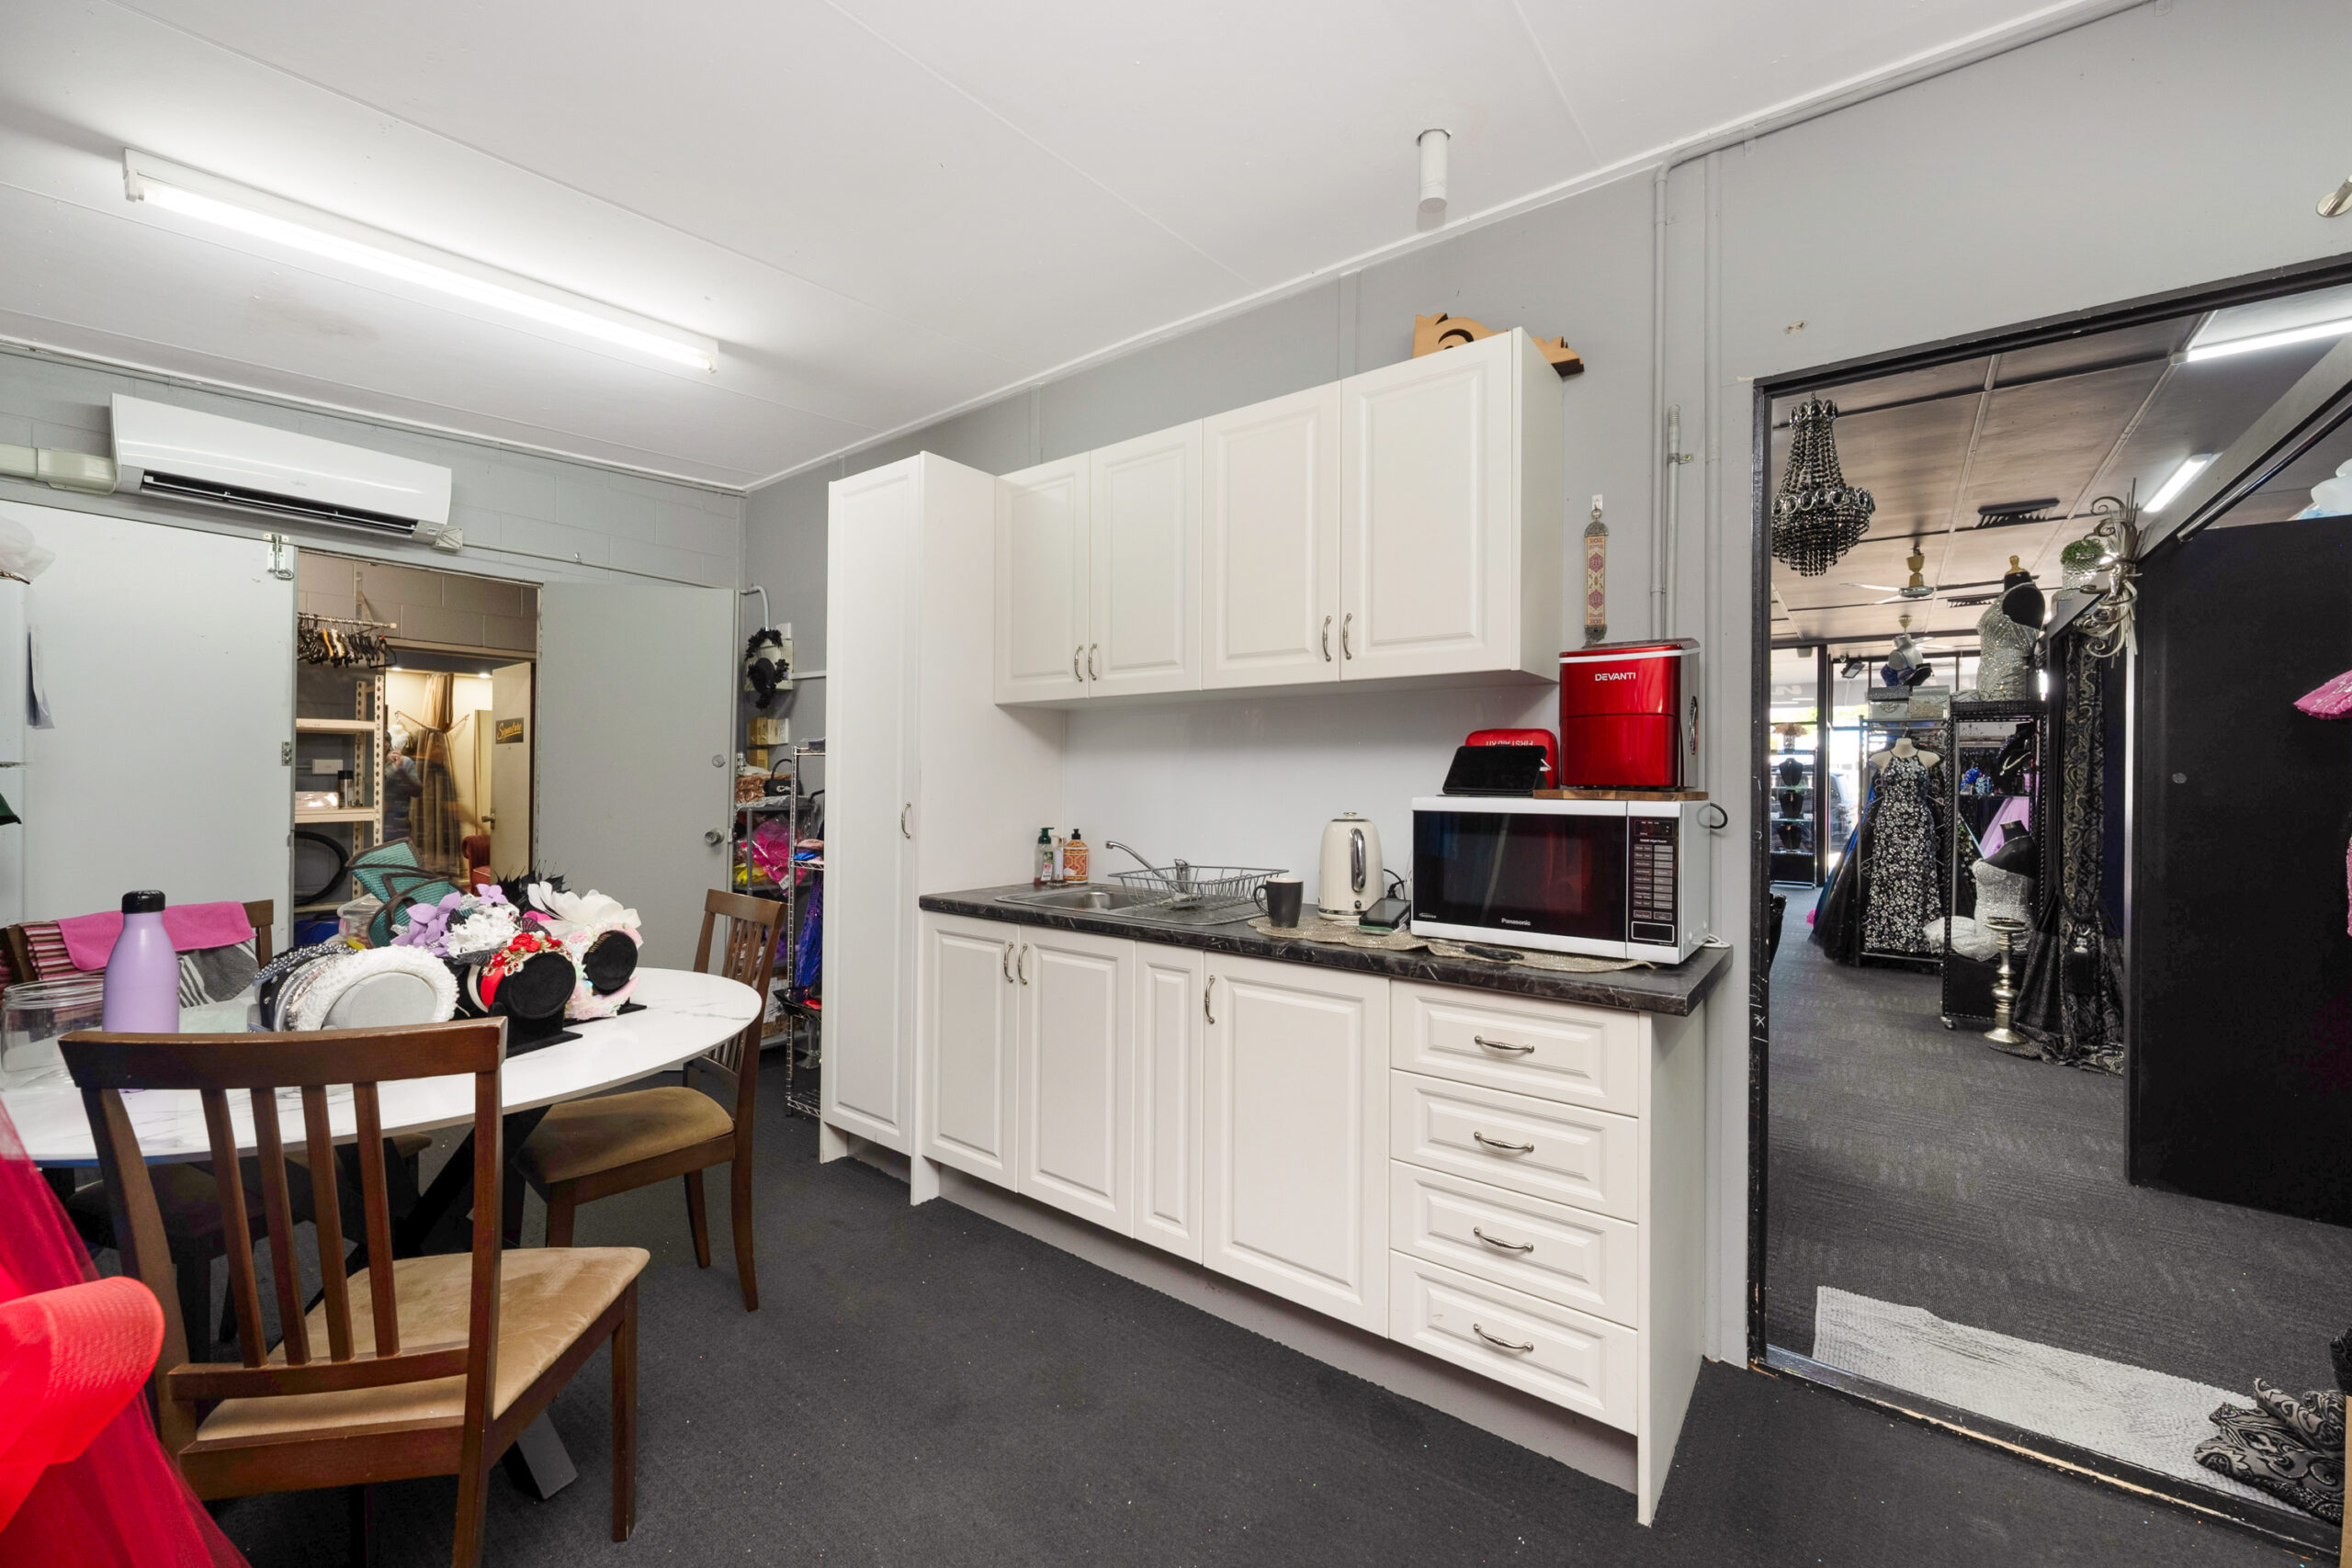
- Fully air-conditioned
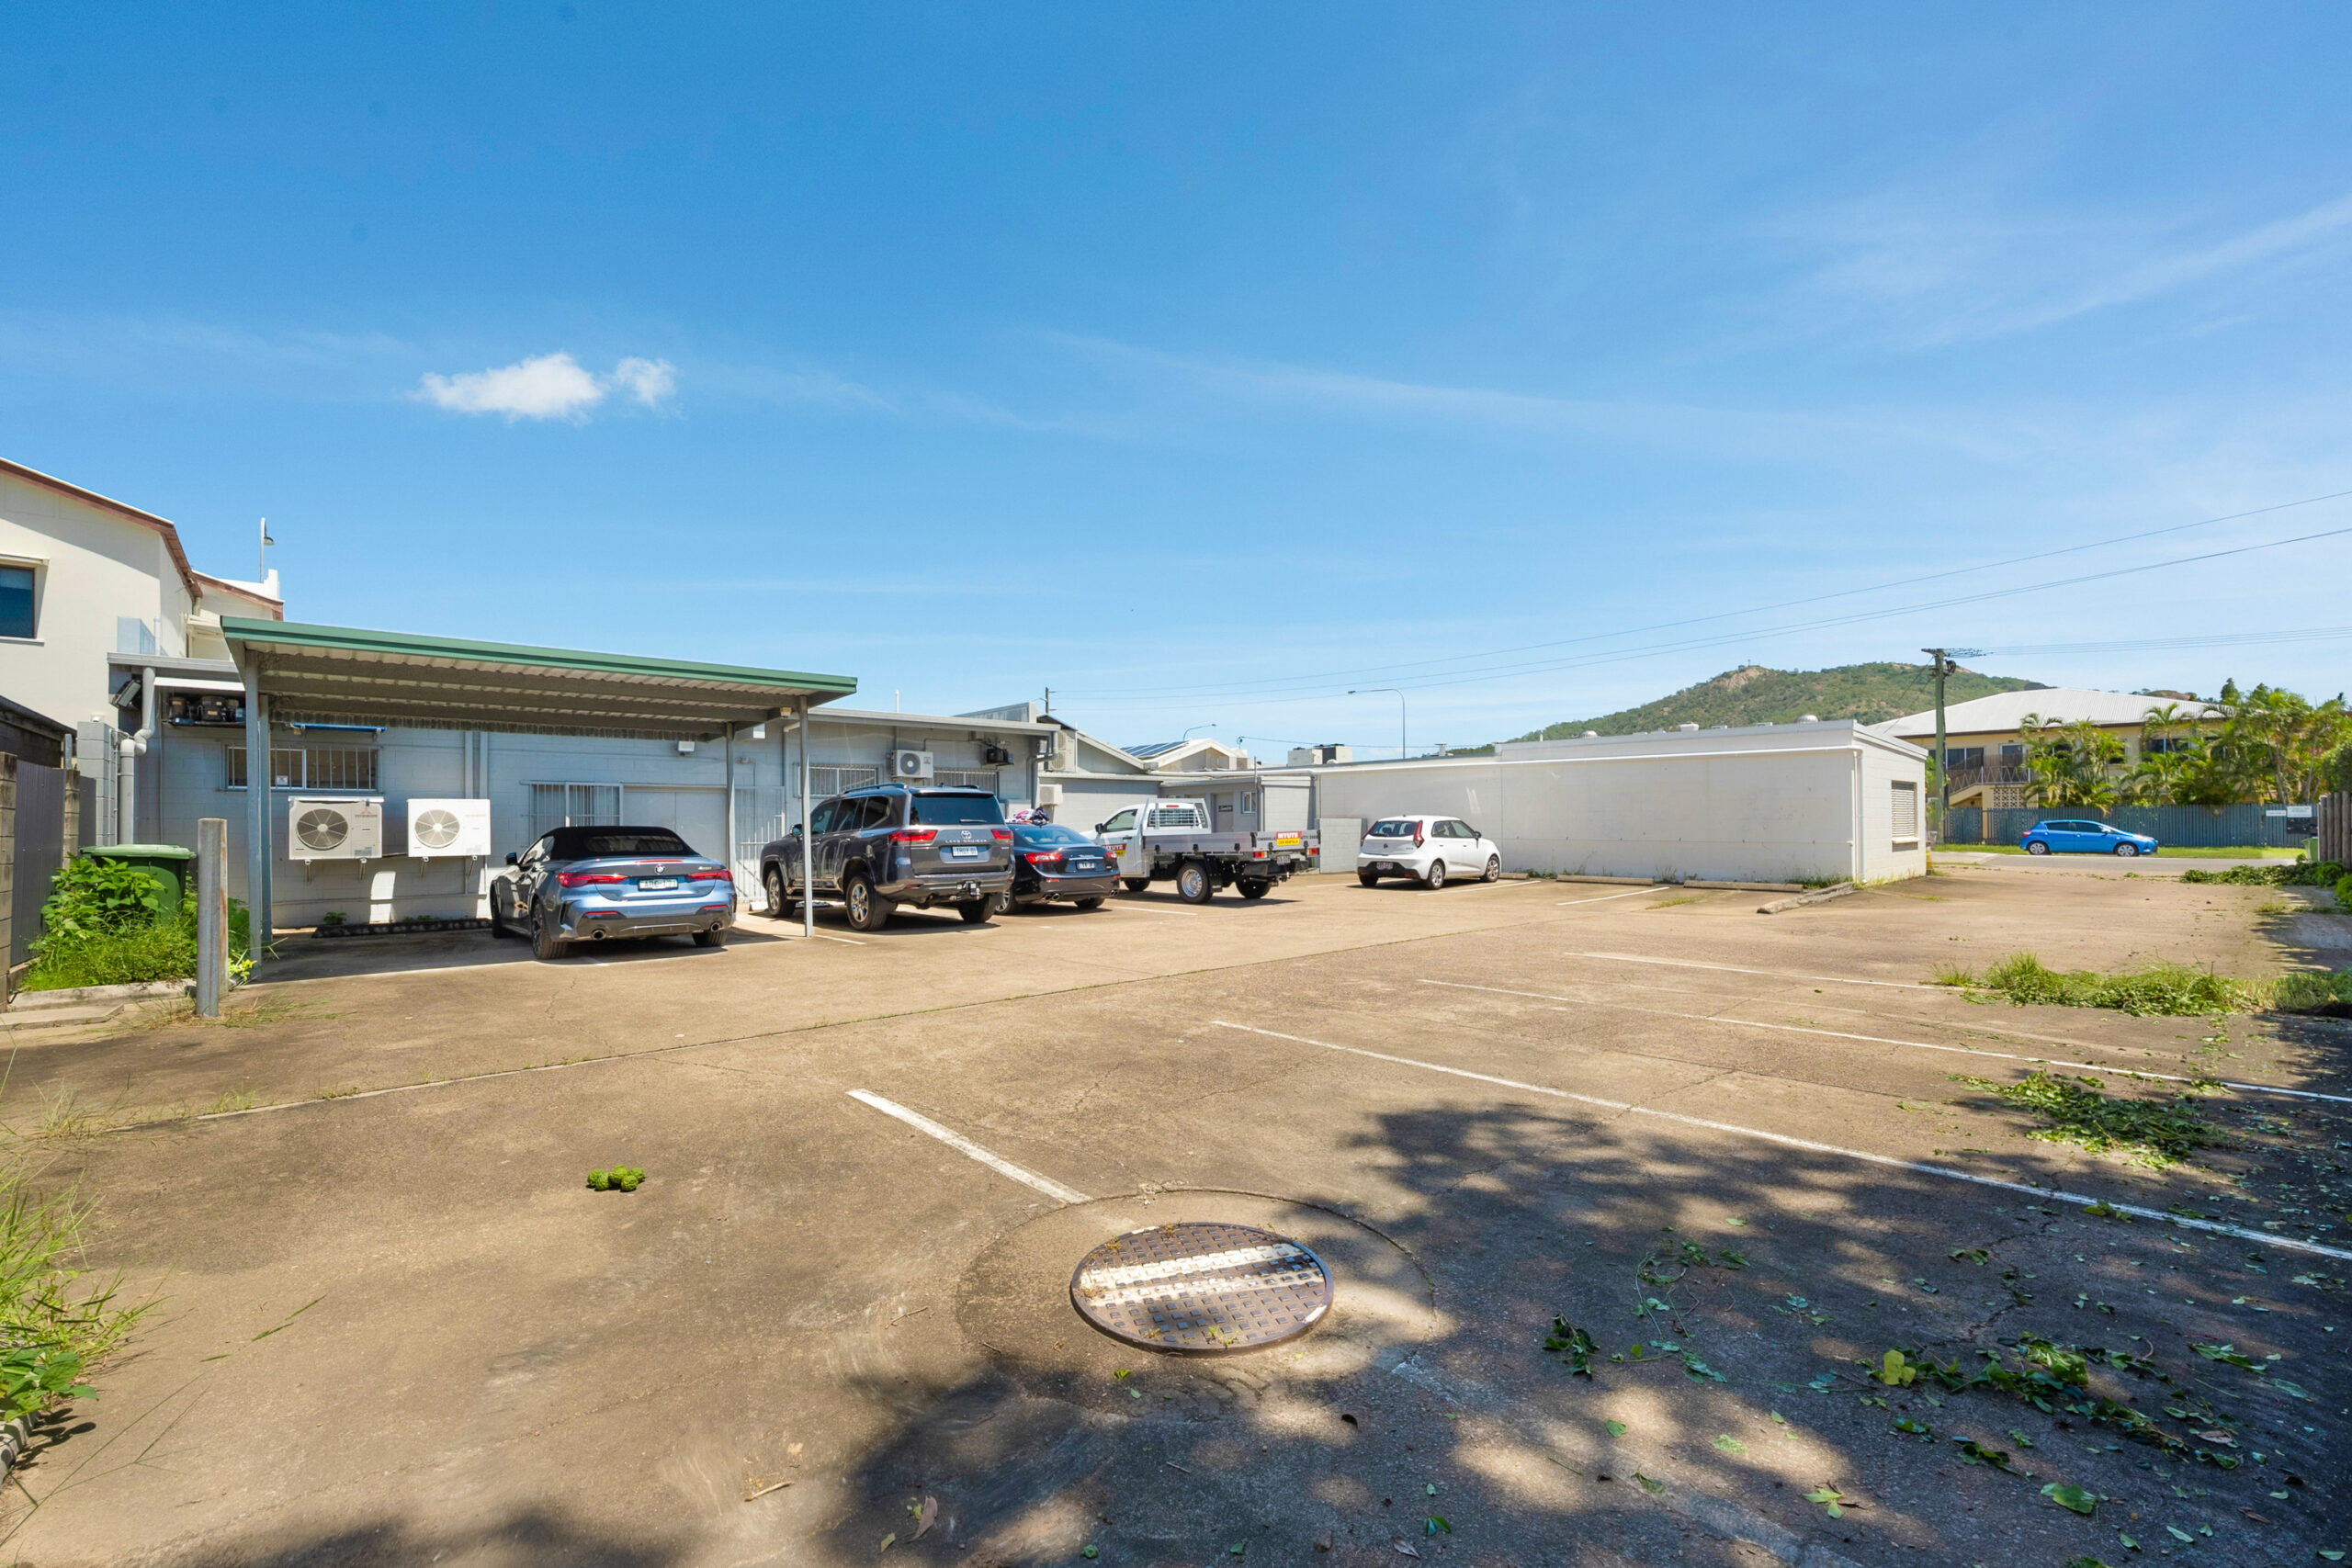
- Rear concreted car park for 12 vehicles
- 2 x bathrooms
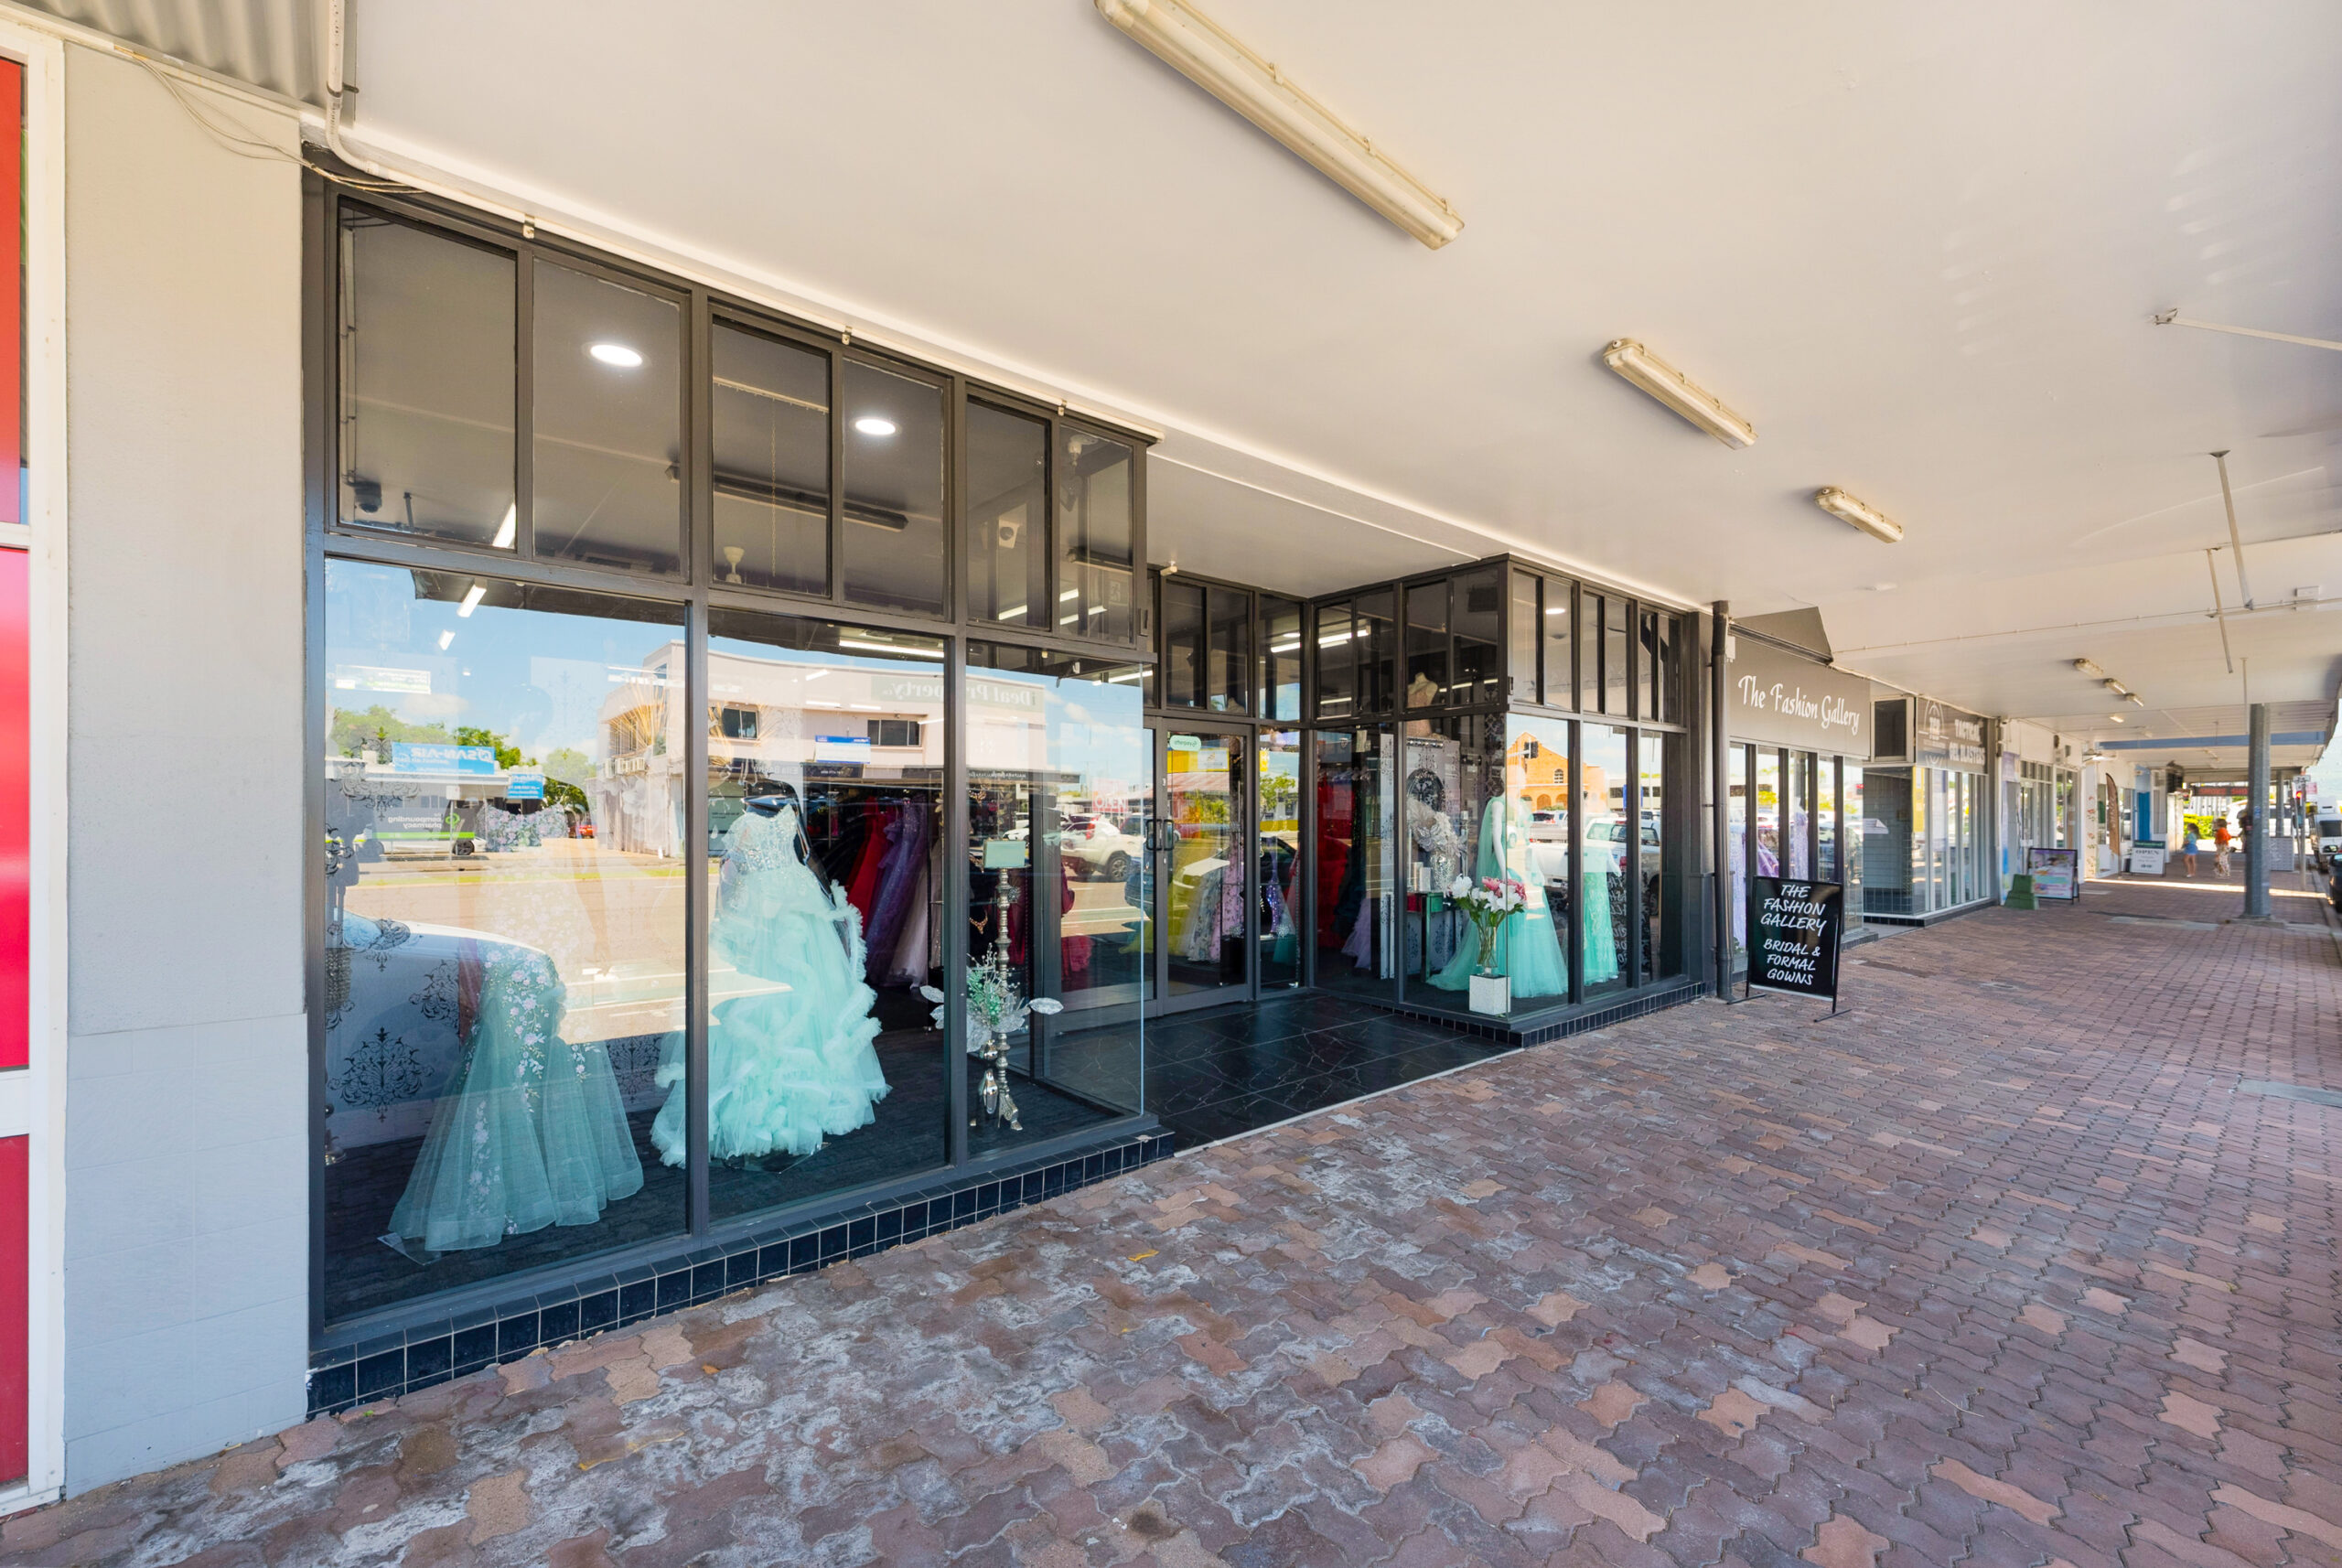
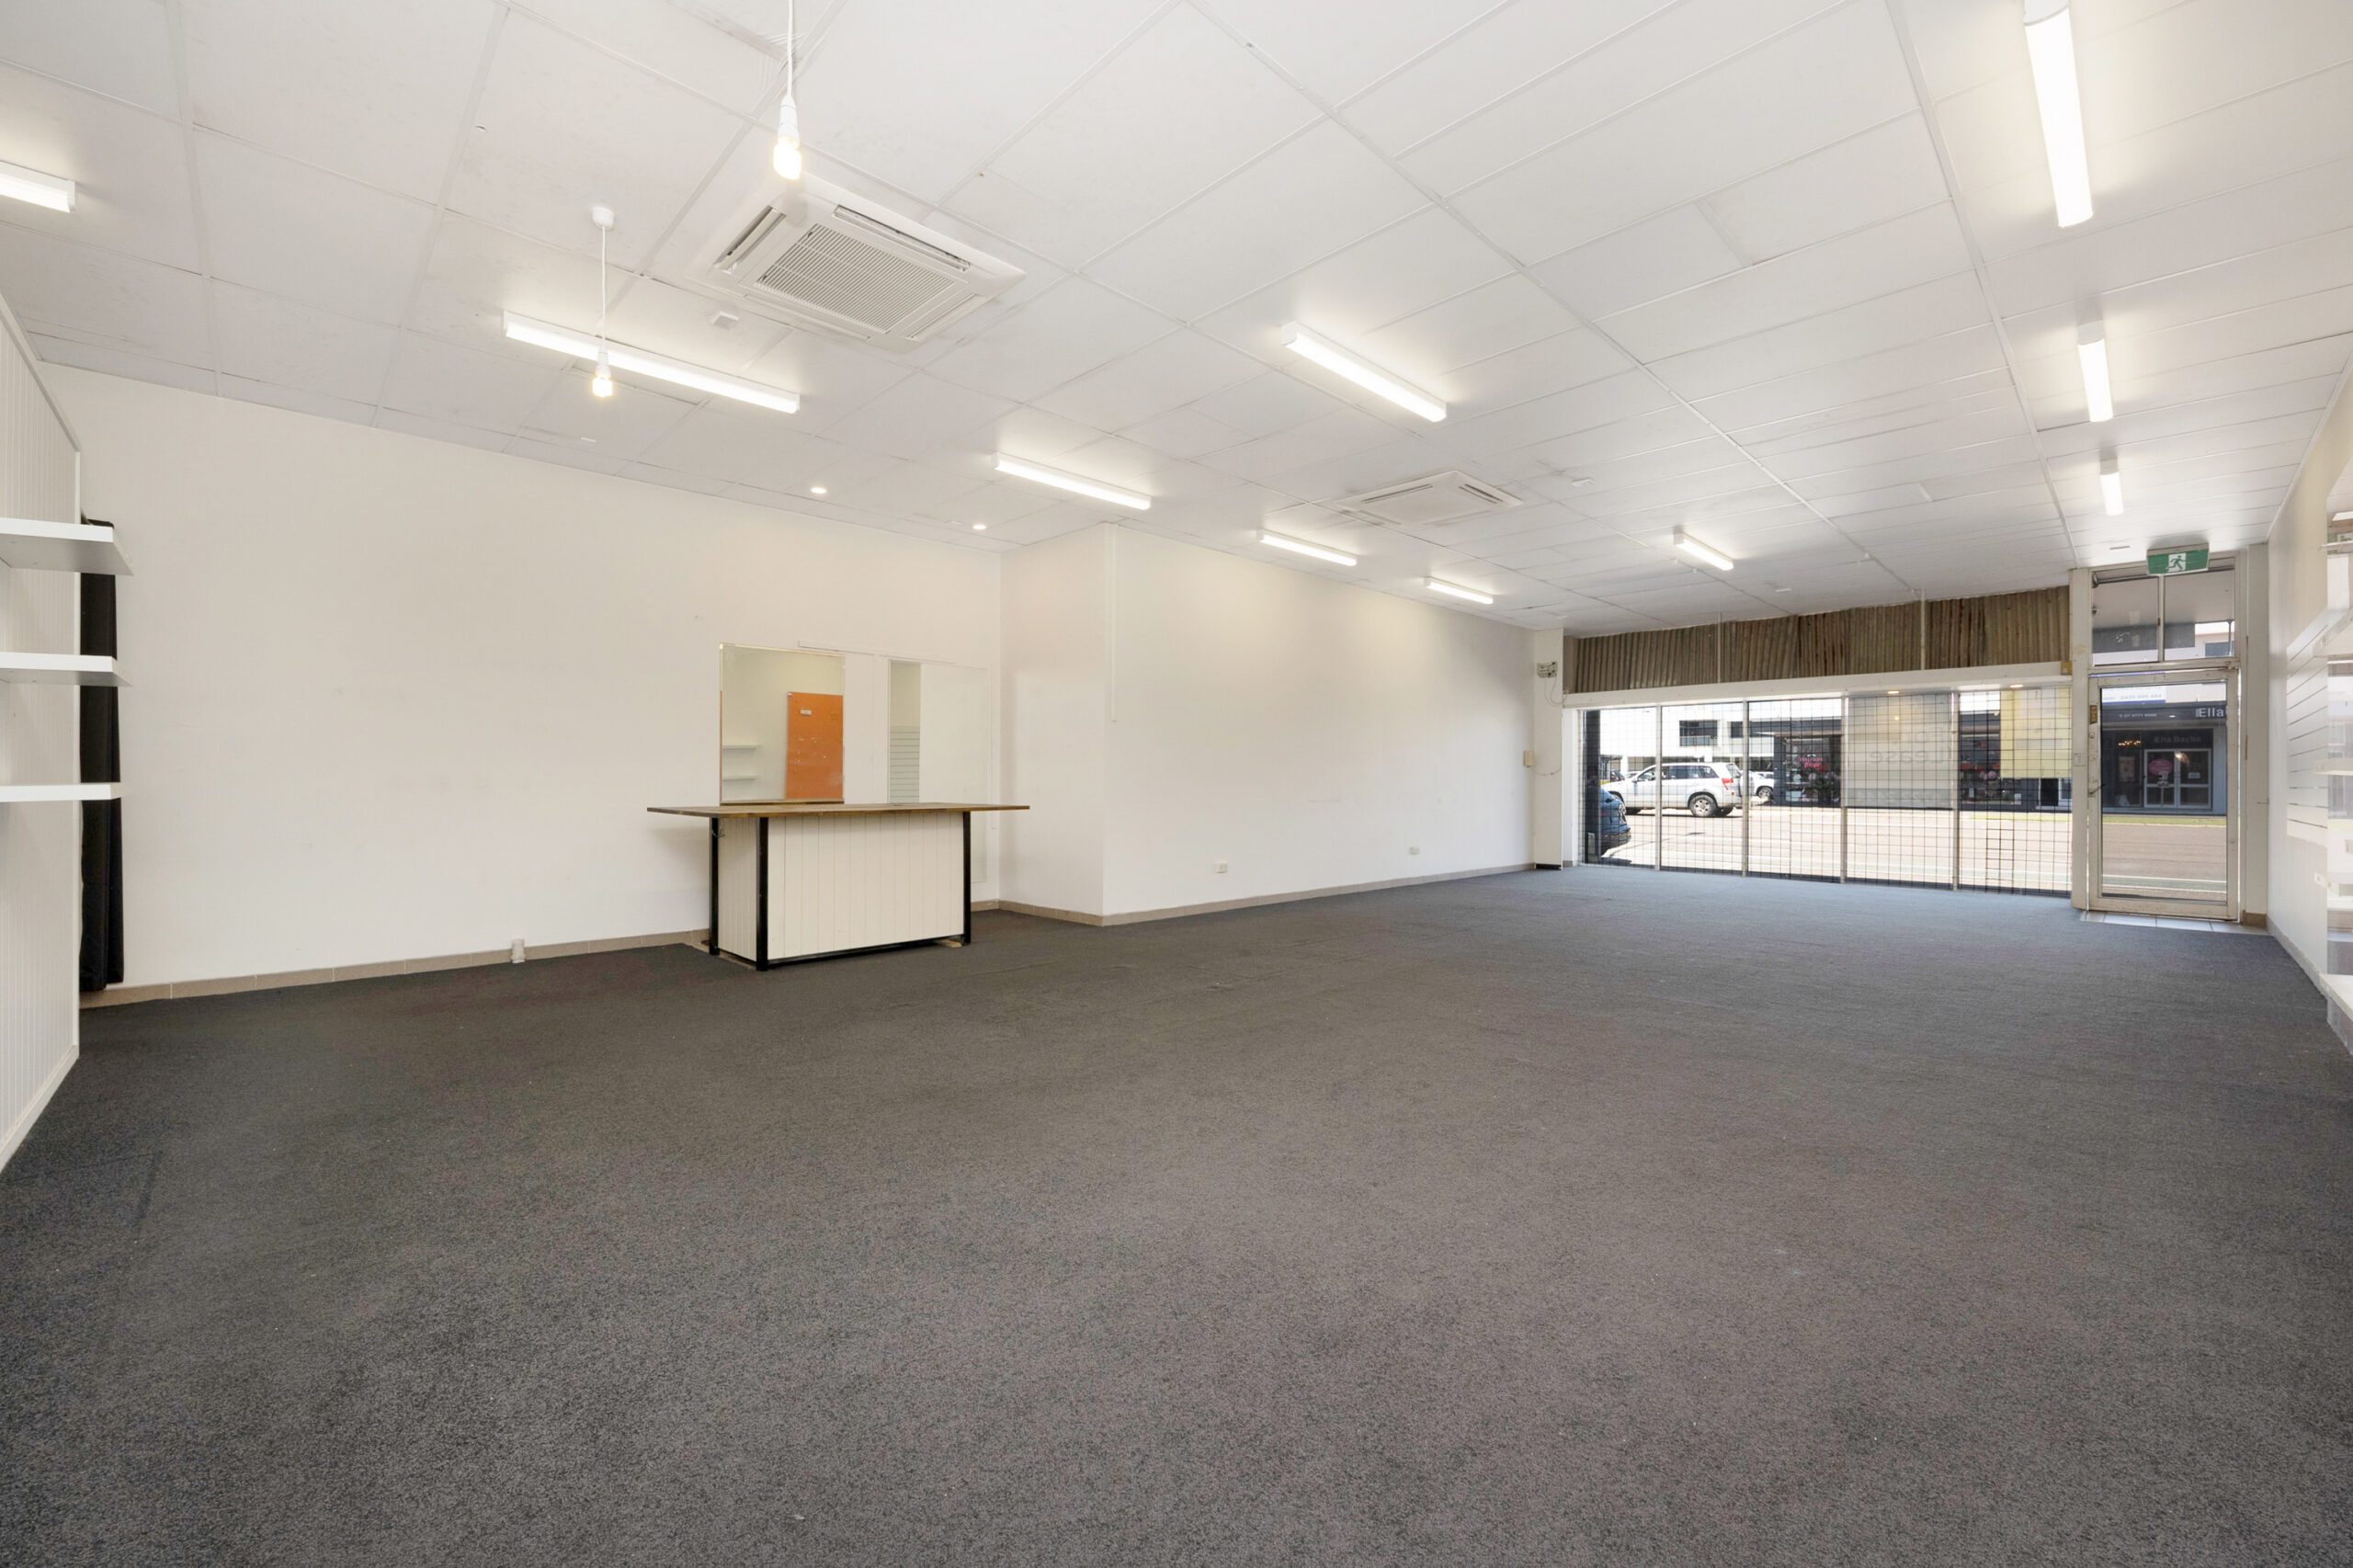
- Glass shopfronts
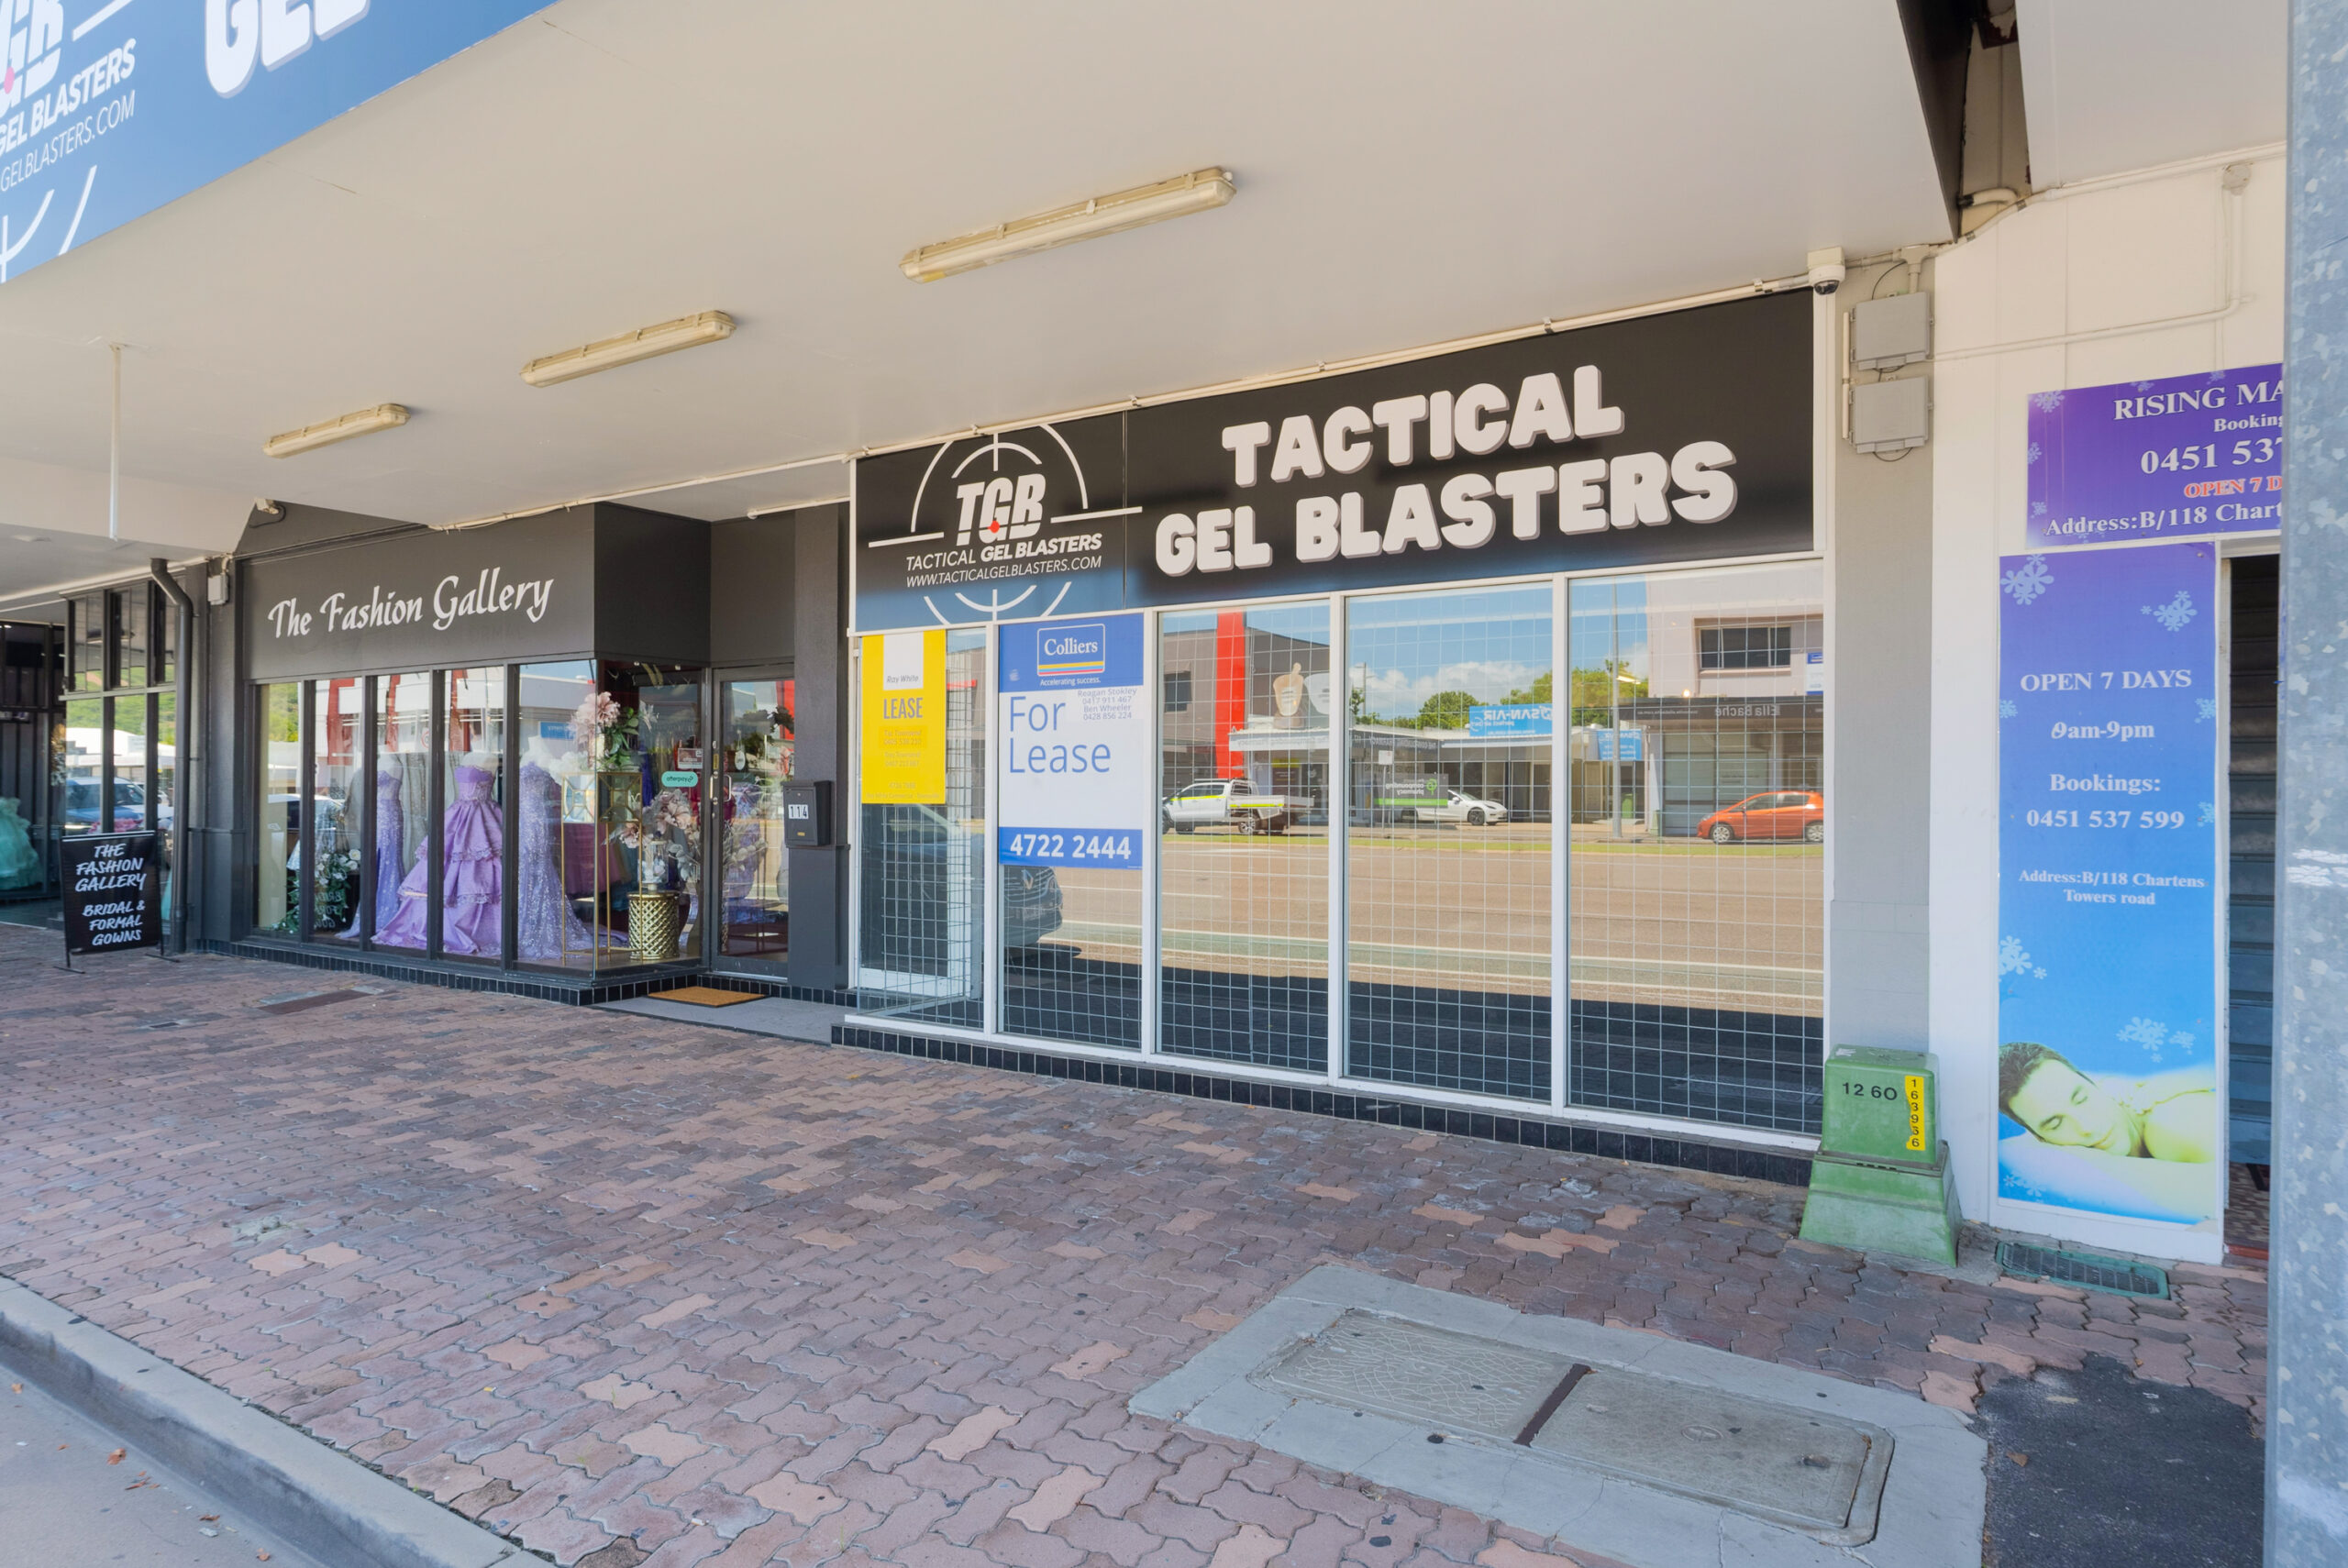
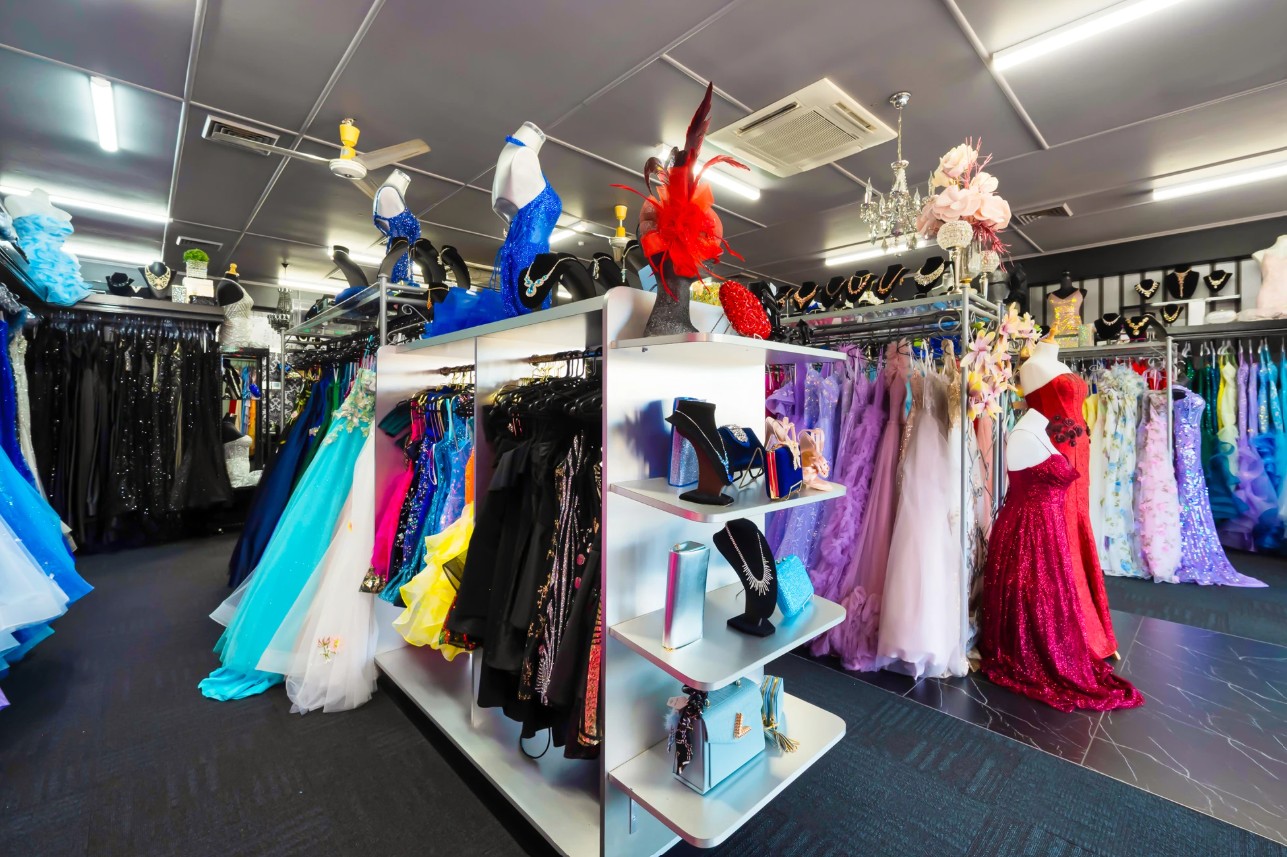
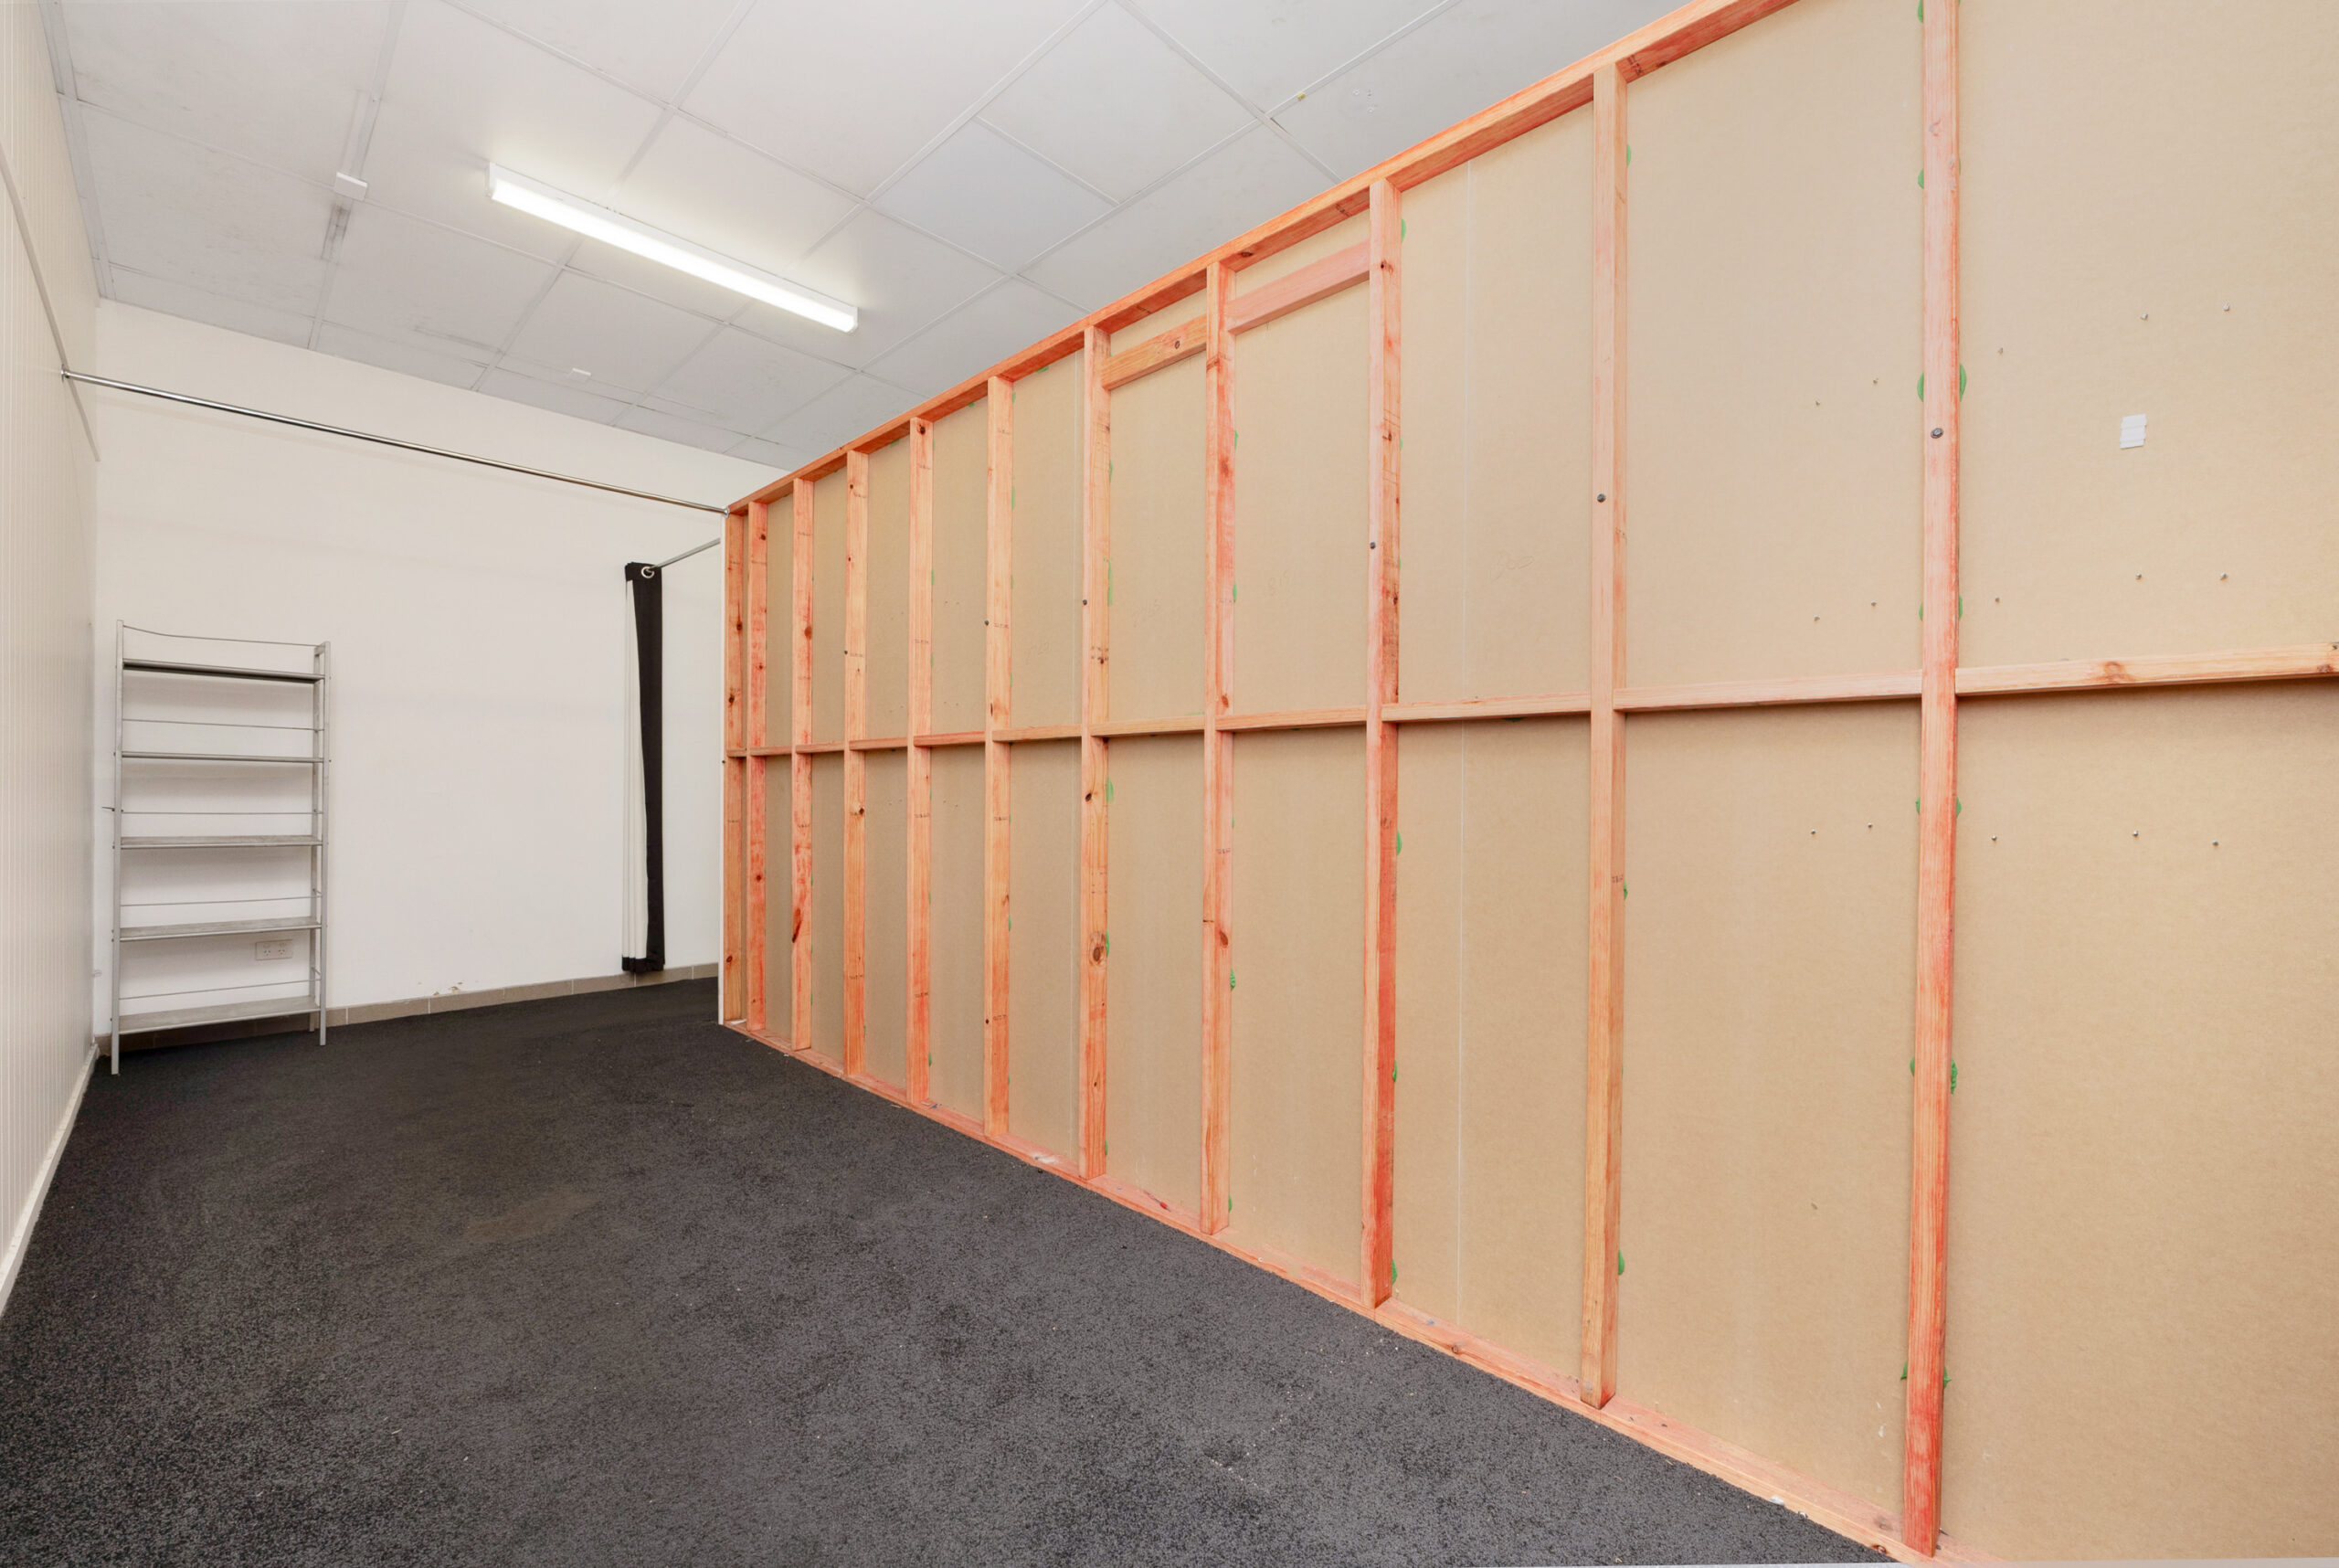
Shops 1 and 2 are currently occupied by The Fashion Gallery, which is vacating in June 2026.
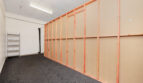
Shop 3 is now vacant and includes hospitality-related infrastructure, including a cold room, freezer, and grease trap.
Each tenancy is already strata-titled, so the new owner can sell a portion of the property separately if they wish.
There is no active body corporate in place, as all three lots have been held by the same owner for a long time.
Other Information
Key Assumptions for Calculation
- Purchase Price (ex GST & Stamp Duty): $1,350,000 AUD.
- GST on Purchase: 10% = $135,000 AUD (This is typically claimable as an input tax credit for a GST-registered entity purchasing a commercial property as a going concern, but it affects initial cash outlay).
- Stamp Duty (QLD Estimate): $46,700 AUD (Estimated using Queensland commercial duty rates for a $1,350,000 property).
- Total Initial Investment: Purchase Price + Stamp Duty = $1,396,700 AUD (assuming GST credit is claimed).
- Gross Annual Rental Income: $11,000/month * 12 = $132,000 AUD.
- Annual Operating Expenses: Estimated at 30% of Gross Rent (covering council rates, insurance, maintenance, property management, etc.). This is a conservative estimate. Net Operating Income (NOI) = Gross Rent – Operating Expenses.
- Capital Growth: Assumed at a conservative average of 3% per annum for commercial property in the area.
- Selling Costs (Exit): Assumed at 3% of the final sale price (covering agent commission, legals, etc.).
- Holding Period: 6 years (with sale at end of Year 6).
- Exit Strategy: Refers to selling the entire property at the end of Year 6. The unique strata-title feature allows for the alternative strategy of selling individual tenancies earlier if desired, but this model assumes a single, bulk sale.
6-Year Investment Analysis Table (All figures in AUD)
| Item | Year 0 (Purchase) | Year 1 | Year 2 | Year 3 | Year 4 | Year 5 | Year 6 (Sale) |
|---|---|---|---|---|---|---|---|
| A. Capital & Sale | |||||||
| Purchase Price (ex GST) | (1,350,000) | ||||||
| Stamp Duty | (46,700) | ||||||
| Total Initial Outlay | (1,396,700) | ||||||
| Projected Property Value* | $1,390,500 | $1,432,215 | $1,475,181 | $1,519,437 | $1,565,020 | $1,611,970 | |
| Less Selling Costs (3%) | (48,359) | ||||||
| Net Sale Proceeds | 1,563,611 | ||||||
| B. Annual Cash Flow | |||||||
| Gross Rental Income | 132,000 | 132,000 | 132,000 | 132,000 | 132,000 | 132,000 | |
| Less Operating Expenses (30%) | (39,600) | (39,600) | (39,600) | (39,600) | (39,600) | (39,600) | |
| Net Operating Income (NOI) | 92,400 | 92,400 | 92,400 | 92,400 | 92,400 | 92,400 | |
| C. Annual Net Cash Flow | (1,396,700) | +92,400 | +92,400 | +92,400 | +92,400 | +92,400 | +92,400 |
| D. Cumulative Cash Flow | (1,396,700) | (1,304,300) | (1,211,900) | (1,119,500) | (1,027,100) | (934,700) | (842,300) |
| E. Key Exit Figures | |||||||
| Total Net Rental Income (6 yrs) | 554,400 | ||||||
| Capital Gain on Sale | 166,911 | ||||||
| (Net Proceeds – Initial Outlay) | |||||||
| Total Profit (Rent + Gain) | 721,311 | ||||||
| F. Return Metrics | |||||||
| Total ROI (Profit / Initial Outlay) | 51.6% | ||||||
| Annualised ROI (Approx.) | 7.2% p.a. | ||||||
| Cash-on-Cash Yield (NOI/Outlay) | 6.6% | 6.6% | 6.6% | 6.6% | 6.6% | 6.6% |
*Property Value Growth: Calculated at 3% p.a. compound from the total initial investment basis of $1,396,700.
Strategic Notes
- GST Treatment: The GST status of the purchase (sold as a going concern) and your own GST registration are crucial. The above model assumes you can claim back the $135,000 GST on purchase, reducing your effective initial cash outlay. Consult an accountant.
- Operating Expenses: The 30% estimate is a placeholder. You must obtain accurate estimates for insurance, council rates, and maintenance for this specific building.
- Exit Strategies (Flexible due to Strata Title):
- Modeled Strategy (Bulk Sale): As calculated, selling the whole asset after 6 years.
- Value-Add Strategy: Re-lease the vacant shops (Shop 3 now, Shops 1&2 from mid-2026) at higher market rates to increase NOI and therefore the property’s sale value.
- Partial Divestment Strategy: Use the strata title to sell one or two tenancies earlier (e.g., after they are re-leased) to recapitalise, reduce debt, and retain a portion of the asset. This can de-risk the investment but may reduce overall scale benefits.
- Development Potential: Investigate if the site has any latent development potential (subject to council approval), which could significantly increase the exit valuation.
Conclusion: Based on the stated figures and assumptions, the investment shows a moderate projected annualised return of 7.2%, driven by a 6.6% cash yield and modest capital growth. The feasibility of this return is entirely contingent on successfully managing the imminent vacancy and re-leasing at current or improved rents. The strata-titled structure provides valuable flexibility for management and exit.
Disclaimer: This analysis is for illustrative purposes only and is not financial or investment advice. Actual investment decisions should be based on professional advice, detailed due diligence, and consideration of all specific circumstances, including future vacancy risks, operating expenses, tax implications, and market conditions.